Table of Contents
The forex market is part of the financial markets and a home for traders having skills and knowledge. If you are good at reading technical signals, you can use them to master your strategies.
What is the entry point in forex?
The forex entry point is a price level at which traders buy or sell currency pairs. The entry price level is determined after careful technical and fundamental analysis.


This article will help you to know how to join an outline and forex trade the following entry market strategies:


- Breakouts
- Channel Trends
- Candlestick Patterns
What is the Best Entry Point in Forex Trading?
The best entry point in forex trading represents the previous resistance (previous high price level) or support level (previous low price), or any critical price level where the price had any reaction in the past. Using candlesticks patterns, Fibonacci levels, Pivot Points, and trading indicators, traders try to find basic price levels to enter into trades.
The best forex entry point often depends on one’s trading strategy: breakout trading, trend trading, counter-trend trading, etc.
Many traders analyze the last 24 hours’ high or low, 7 days’ low or high, 30 days’ low or high, etc. These previous resistance or support levels are very important in a trading decision. For example, if the price breaks the last 30 days’ high or 30 days’ low, that forex entry point has a higher probability of a new stronger trend continuation.
Breaking the high or low of the last 30 days is a significant event in forex trading, often used as a “breakout” strategy. This strategy assumes it will continue in that direction when the price breaks a fundamental level. The underlying theory is that these breakouts represent a strong trend and can thus generate profitable trading opportunities.

Please watch my video about key-level forex strategy:
Here are a few reasons why this strategy is significant:
- Shows Market Sentiment: A break of a 30-day high or low indicates strong market sentiment in the direction of the break. This breakout could result from solid buying or selling pressure, which might continue for some time.
- Initiation of a New Trend or Continuation of an Existing One: If the price breaks a 30-day high, it may suggest the start of a new uptrend or the continuation of an existing uptrend. On the other hand, a break of a 30-day low might suggest a new downtrend or the continuation of a current downtrend.
- Volume Increases: A 30-day high or low break can attract more attention from other traders and increase trading volume. Higher volume typically increases liquidity, making getting in and out of trades at desirable price levels easier.
- Psychological Levels: The 30-day high and low are often seen as psychological levels in the market. Once these levels are broken, it could lead to a rush of trading activity as traders respond to this event.
Pivot Points as Forex Entry Points
Pivot points are technical analysis indicators used to determine potential support and resistance levels derived from the previous trading period’s high, low, and closing prices. These can help identify potential entry and exit points in the forex market for several reasons:
- Predictive Indicator: Pivot points are unique in that they are predictive indicators instead of lagging ones. They use the previous day’s trading range to predict potential turning points for the current trading day, showing traders where support and resistance are likely to occur before the market opens.
- Multiple Levels of Support and Resistance: Pivot points provide multiple support and resistance levels (S1, S2, S3, R1, R2, R3), offering multiple potential entry points for trades. For instance, traders may choose to enter a long position at a support level or a short position at a resistance level.
- Identification of Market Sentiment: The pivot point (P) is significant. If the market opens above the pivot point, this is typically seen as a bullish sentiment, and if it opens below the pivot point, this is seen as bearish. Traders can use this information to help determine their bias for the trading day.
- Versatility: Pivot points can be used for different time frames, such as daily, weekly, or monthly periods, making them suitable for all kinds of traders, from day traders to swing traders and even long-term traders.
- Risk Management: Pivot points can also help set stop losses and profit targets. For instance, a trader might set a stop loss just below a pivot point support level or take a profit at a pivot point resistance level.
- Widely Used: Pivot points are widely used by forex traders, increasing their significance due to the self-fulfilling prophecy phenomenon. The more traders watch and react to these levels, the stronger these support and resistance levels can become.
See my Pivot Points forex entry points strategy video:
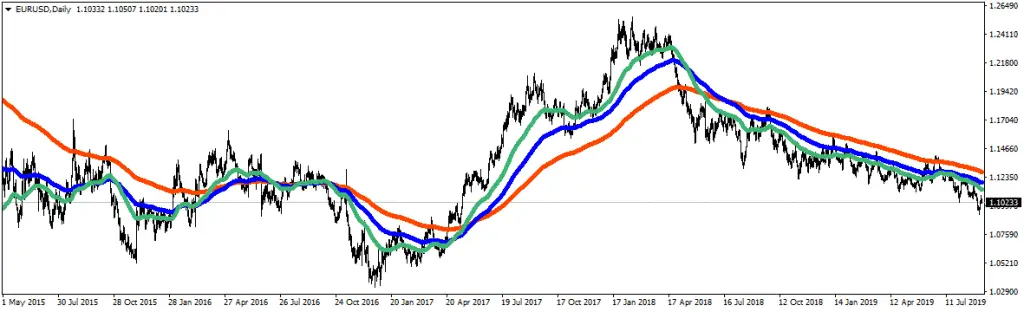
200 Moving Average Breakout Forex Entry Point
The 200-day moving average, whether the Simple Moving Average (SMA) or Exponential Moving Average (EMA), is one of the most widely used indicators in forex trading.
The breakout strategy based on this indicator has gained popularity for several reasons:
- Long-Term Trend Indicator: The 200-day moving average represents approximately a year’s worth of price data (assuming trading occurs 200 days per year), making it a reliable measure of the long-term trend. If the price exceeds the 200-day MA, it’s often considered a long-term uptrend, and vice versa.
- Key Psychological Indicator: The 200-day moving average is watched by many traders and investors. It is seen as a crucial level of support and resistance. When the price exceeds the 200-day moving average, it’s considered bullish (a possible buy signal), while crossing below is seen as bearish (a possible sell signal).
- Reducing Noise: The 200-day moving average helps filter out market noise and provides a clearer picture of the market trend. This information can help traders make more informed decisions.
- Risk Management: Traders often set their stop-loss levels around the 200-day moving average. For instance, traders might place a stop-loss order just below the 200-day moving average in an uptrend.
- EMA vs. SMA: While both are used, they have different characteristics. The EMA gives more weight to recent prices, making it more responsive to new changes. Meanwhile, the SMA gives equal weight to all values, providing a more stable and less reactive indicator. The choice between EMA and SMA depends on the trader’s strategy and preference.
- Confirmation Tool: The 200-day moving average can also be used with other indicators or strategies to confirm trading signals. For example, a breakout above a critical resistance level might be seen as a stronger buy signal if a crossover above the 200-day moving average also accompanies it.
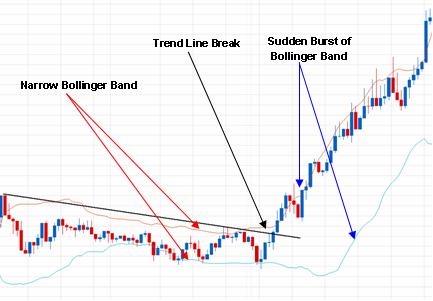
Channel Trends as Entry Point
Trend lines are essential tools tech specialists use at resist levels and identify support. A higher downward movement and an apparent higher high representing a prominent latest trend help you regulate the latest purchasing bias at taking profit and support to resistance. When rates break, the key levels keep resistance and support, and sellers must be attentive to a potential reversal or breakout trend.
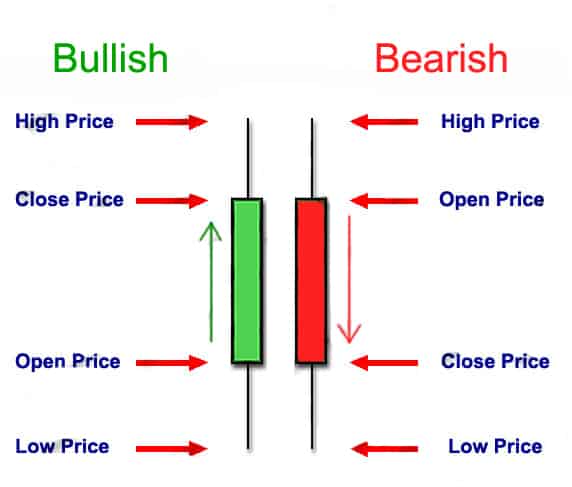
Candlestick Patterns and Entry Point
Candlesticks represent a type of price chart that displays a security’s high, low, open, and closing prices for a specific trading period and can be excellent triggers to enter into trade.
A Candlestick pattern is a beautiful tool to utilize by traders to watch for entry signals and points for Forex Entry IndicatorKnowledgeable traders regularly use patterns like shooting stars and engulfing. For example, the hammer candlestick pattern can be visible at the reverse trigger point on USD/EUR.
Recognizing the hammer or other candlestick pattern does not settle a Forex entry point into the sale. Therefore, Forex Entry Point is very significant in classifying the candlestick pattern. In addition, Forex Market Entry Strategy further assists you in validating the candlestick pattern, thus, giving traders and risking less to a greater probability of accomplishment.
Hammer Candlestick Pattern Chart
For example, The bullish inverted hammer represents a small body candle, a long upper wick, and little or no down wick. Read more about candlestick patterns.
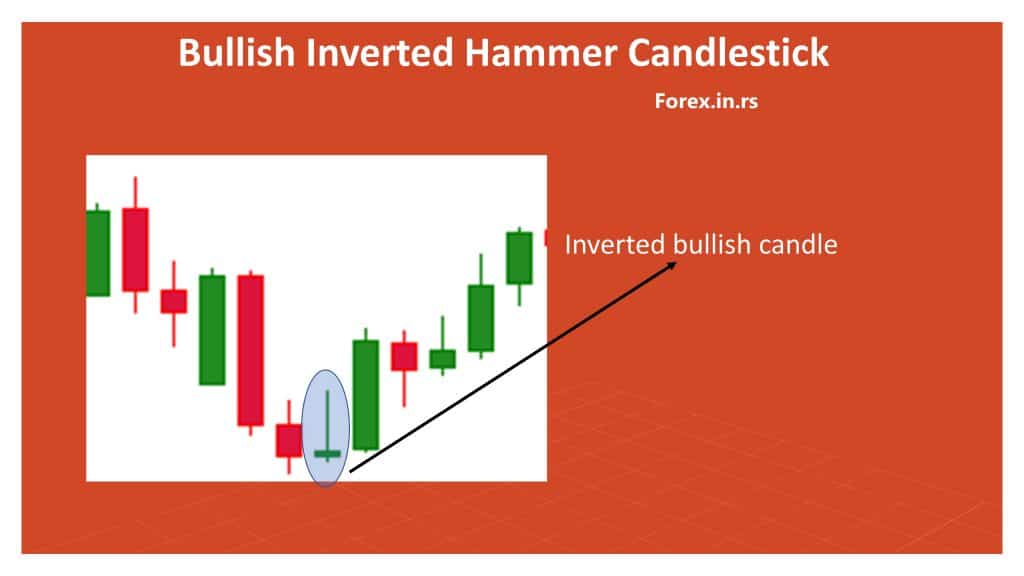
This shows that the hammer signals can be reversed without confirmation; the pattern might display an incorrect signal. In such cases, the entry can be recognized after getting the approval of the close of the hammer candlestick. This helps you to provide a more substantial bias to the endorsement and trader of the hammer candlestick pattern.
Traders frequently look for signs of trade support, like indicators in combination with candlestick patterns, news, and price action. However, we have experienced various strategies for this article’s constituent parts for ease.
See my strategy based on the Rising Wedge pattern:
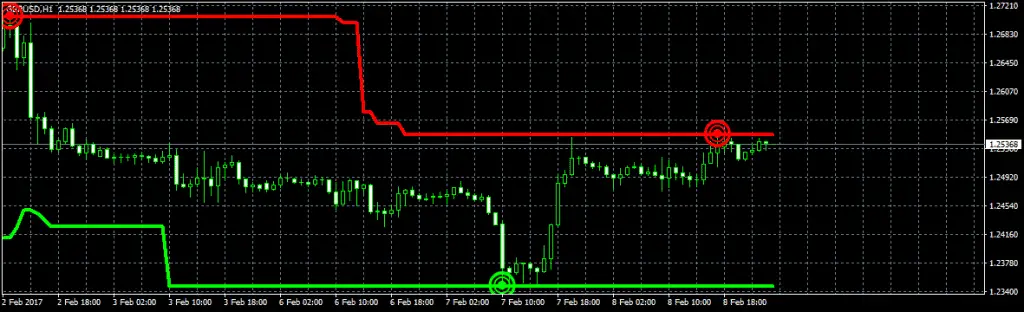
Breakout price levels as an entry point
Utilizing breakouts as signals entry is one of any trader’s most used trade entry tools. Breakout trading includes classifying key levels and utilizing these as indicators to join trades. Price action professionals are in the leading role to become successfully utilize breakout strategies. The base of breakout exchange comprises forex rates that keep changing beyond a defined level of resistance or support.
The ease of this policy and breakout join points are very much appropriate for beginner traders. In other cases, market participants seek the validation of candlestick closed outside for the defined level.
Here are one breakout strategy example and entry point determination:
Trading indicators and entry point
The best forex entry indicator is linked with the trading strategy. Therefore, indicators are used daily to support the abovementioned strategies.
The RSI indicator and entry point
On the RSI indicator, traders can draw a trendline and use it for entry signals.
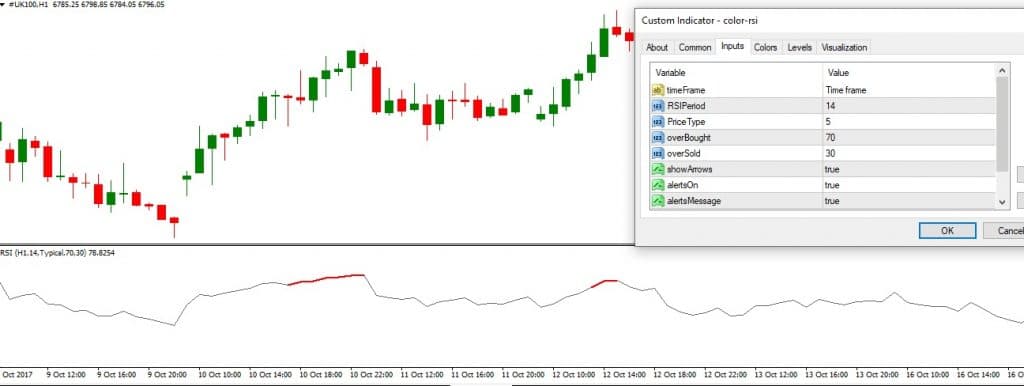
It will help you to identify overbought and overvalued signals—the most productive within trending markets and range bound.
See my RSI trading strategy explanation and entry point determination:
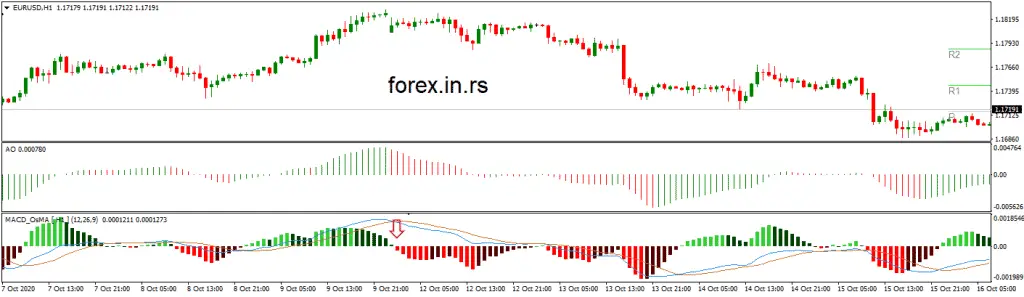
MACD indicator cross as an entry point
MACD will work best in the trending markets or a given range. Using MACD with two lines, you can quickly determine entry points like this red arrow in the image below.
Conclusion
Selecting entry points in forex trading is critical to any trading strategy, significantly influencing potential profit and risk. Various strategies utilize different indicators and models to identify these key entry points. These include support and resistance levels, moving averages, Fibonacci retracement levels, pivot points, trend line breaks, and more.
Each entry strategy has its unique advantages and rationale:
- Previous Highs and Lows: These levels act as psychological barriers where price has shown a reaction in the past. A breakout beyond these levels indicates strong market sentiment and can initiate or continue a trend.
- Moving Averages: The crossover of price with moving averages, particularly the 200-day SMA or EMA, can signal a change in trend. The 200-day moving average is a crucial long-term trend indicator and reduces market noise.
- Break of 200 SMA on the Daily chart
While the above strategies can provide valuable insights and potential opportunities, it’s important to remember that they don’t guarantee success. Each method has its limitations, and market conditions can change rapidly. Moreover, these strategies should be used with other essential trading principles, including risk management, proper position sizing, and adherence to a trading plan.
Every trader needs to find an entry strategy that fits their trading style, risk tolerance, and the market in which they’re trading. It’s also worth noting that successful trading requires ongoing learning, practice, patience, discipline, and, sometimes, the ability to go against one’s intuition. And, importantly, it involves understanding that losses are part of the game and should be factored into any comprehensive trading strategy.

He is an expert in financial niche, long-term trading, and weekly technical levels.
The primary field of Igor's research is the application of machine learning in algorithmic trading.
Education: Computer Engineering and Ph.D. in machine learning.
Igor regularly publishes trading-related videos on the Fxigor Youtube channel.
To contact Igor write on:
igor@forex.in.rs
