Table of Contents
A financial market is an uncertain place. One cannot predict the exact movement of the price of any instrument in the market. But traders and analysts can at least indicate the trend that may follow with the indicators’ help. The trend means the expected direction of the price of a particular instrument or security. There is more than one type of indicator, and each has its process of predicting the pattern of a trend in price.
Indicators can provide signals for almost all financial instruments but, most importantly, for Forex. One can have a real-time analysis of the complete price movement in the market.


What is a divergence in forex trading?
Divergence is the price movement process when an asset’s price (currency pair) moves in the opposite direction of a technical indicator, usually an oscillator. Divergence warns that the current price trend may lead to a price-changing direction.


Divergence is a situation in the market when there is contradictory movement between the oscillator, for example, RSI, and the price of an instrument. In only theory – divergence warns the trader not to believe in the price movement as the situation may get reversed, i.e., the asset’s price will start moving in the opposite direction of the current trend.
Understanding the divergence can be more evident if you use a combination of indicators. One can choose among many available indicators. The Relative Strength Index (RSI), Moving Average (MA), Bollinger Bands, Stochastic Oscillator, and many more are the most commonly used. If the trader or the analyst can understand the pattern correctly, they will know the correct time to enter or exit the market without facing any loss or may make some profits.
Trading Divergence
As the name suggests, ‘divergence’ indicates a change in direction. Here, the trading market offers the difference in price movement. The security price and the trader’s indicator should move in the same direction or suggest the same trend. But when they do not agree with each other, the result is divergence.

The divergence can be both negative and positive. The positive divergence signals that there may be a positive (upward) movement in the price. It is indicated when the technical indicator is moving higher, but the price is moving lower. This type of signal is known as a bullish signal or bullish divergence.
The negative divergence signals that there may be a negative or downward trend or movement in the price. It is indicated when the technical indicator shows a lower movement, but the price shows a higher direction. This type of signal is known as a bearish signal or bearish divergence.
These divergences lay between the high and low points, shown by the price and indicators. Thus, divergences can be classified into four types depending on the price position and the indicator.
Four types of divergence in forex are:
- Regular Bullish
- Hidden Bullish
- Regular Bearish
- Hidden Bearish
Let’s understand these four types of divergences in detail.
Regular Bullish Divergence
Regular Bullish Divergence is a usual signal of an upcoming bullish trend in an instrument’s market price. This divergence indicates a lower price, but the indicator shows a higher low. Regular bullish divergence suggests that an upward trend will replace the ongoing bearish or downward trend. At this point, traders may go long, expecting a favorable return on their investment.
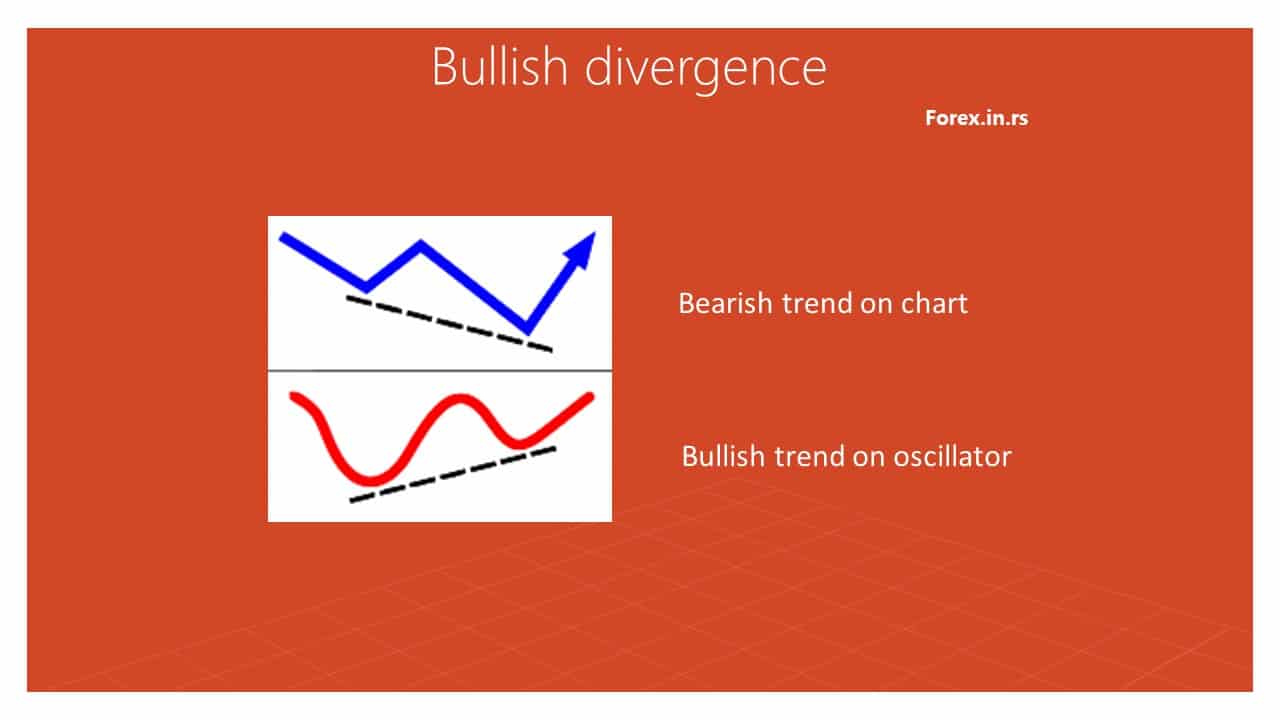
Regular divergences are perfect indicators of a possible reversal in the trend.
Hidden Bullish Divergence
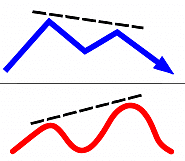 Hidden Bullish Divergence also shows a possible upward trend but with a signal that the trend will continue. It means that if it is an upward trend, it will continue to go upward. It is indicated when the price shows a higher low, but the indicator shows a lower low. This marks the end of a downward trend and indicates a start and continuation of an upward or bullish trend.
Regular Bearish Divergence
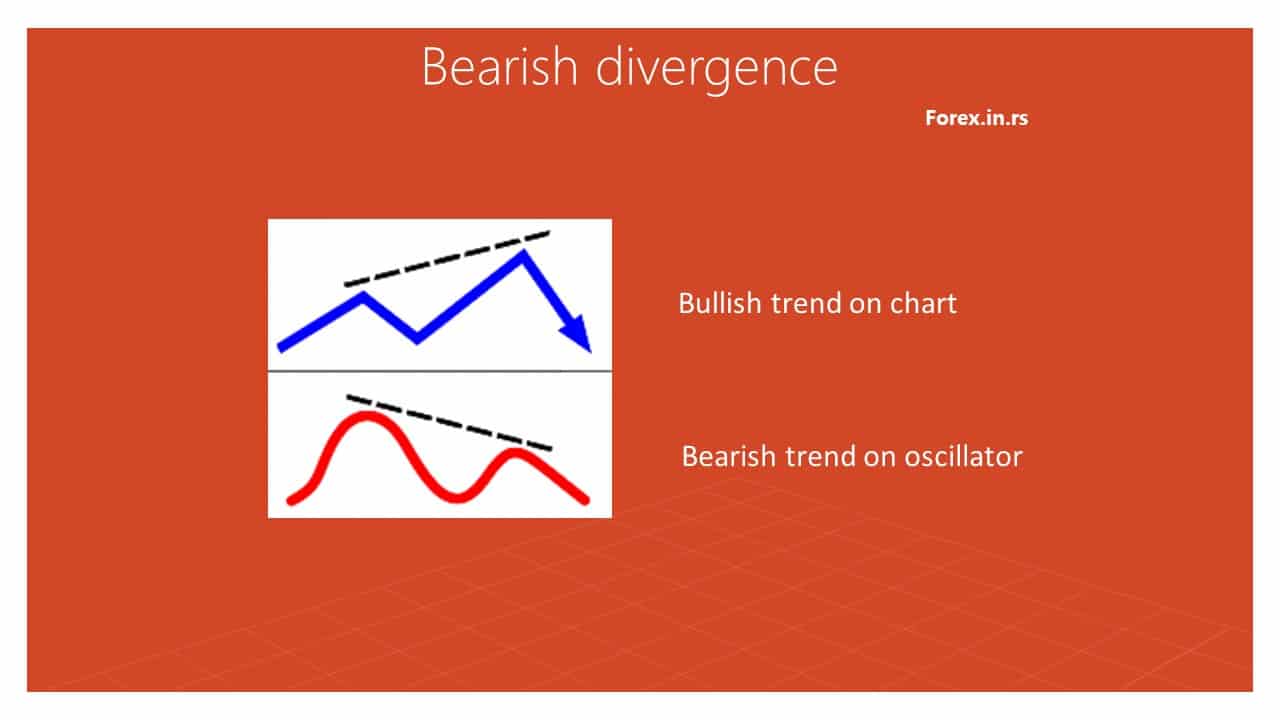
Contrary to the Regular Bullish Signal, Regular Bearish Signal shows an upcoming downward trend in the market. This is indicated when an asset’s price shows a higher high while the indicator shows a lower high. This divergence occurs in the uptrend that signals the traders to find a way out of the market before the downtrend approaches.
Hidden Bearish Divergence
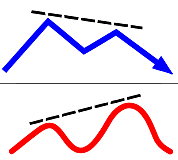 When the downward trend approaches with a signal of continuation, it is known as Hidden Bearish Signal. It indicates that the price will start to fall and will continue to fall for a while. This divergence approaches when the price shows a lower high while the indicator shows a higher high.
How to trade divergence in Forex?
To trade divergence in the forex market, you need to identify when the trading price moves in the opposite direction of the oscillator indicator, such as MACD or RSI. After bullish or bearish divergence identification, you need to enter a trade when the price touches a vital price level (previous support, previous high, Fibonacci level, Pivot level).
The best divergence trading strategy uses the RSI 50-level principle.
The Best Divergence Trading Strategy
The Best Divergence Trading Strategy assumes that the chart’s fastest rising or falling trend is around the 45 and 55 Relative Strength index. Therefore, if we create an experiment and make buy or sell trades based on Relative Strength Index RSI divergence, the best results for bullish and bearish trades will be when the RSI value is around level 50.
Divergence trading strategy steps are:
- Identify when the trading price moves in the opposite direction of the oscillator indicator, such as MACD or RSI.
- Wait until the RSI signal is between 45 and 55 levels.
- Enter into a BUY trade if the RSI signal is between 45 and 55 levels, the oscillator price rises, and the price trend line is bearish.
- Enter into a SELL trade if the RSI signal is between 45 and 55 levels, the oscillator price is a downtrend, and the price trend line is bullish.
See an example of the weekly Divergence Trading Strategy:
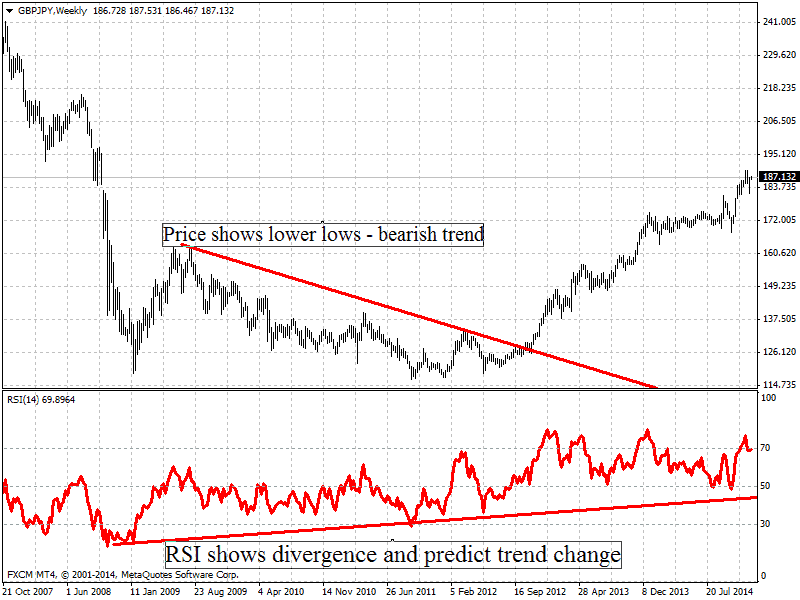
I picked a long-term period, weekly chart, to better see how the divergence strategy works.
On this GBPJPY weekly chart, we can see August 23. 2009 bearish trend. The RSI indicator is in a bullish trend. But several months’ price was going down. The bullish trend started in February 2012. So most three years in bullish divergence, and the price went down.
The bullish divergence rising trend started around 50 levels.
The same 50-level divergence principle can be applied to divergence day trading strategy, hourly chart, or daily chart. However, the divergence strategy performs best on long time frames such as daily, weekly, and monthly charts.
Divergence in Forex Trading
With careful practice and using the right indicator, one can quickly get used to tracing divergences in the charts. But in some instances, one must not confuse slight differences between the price and the indicator’s movement as a fundamental divergence. Understanding this concept can prove to be profitable for you. For example, one who is well aware of the divergences knows that it is suggested to sell when the price is at the top and buy when the price is at the bottom.
Divergence brings out the analytical strength of a trader. Once you are comfortable trading with the divergence, you can move upward in the market with this acquired knowledge. Trading in instruments like Forex will become much easier with time. It is a fantastic tool and can be a friend who warns you of any market changes.

He is an expert in financial niche, long-term trading, and weekly technical levels.
The primary field of Igor's research is the application of machine learning in algorithmic trading.
Education: Computer Engineering and Ph.D. in machine learning.
Igor regularly publishes trading-related videos on the Fxigor Youtube channel.
To contact Igor write on:
igor@forex.in.rs
