Table of Contents
The high-low moving average is a formula that allows a person to quickly calculate the high and low average for a specific interval. Traders sometimes use this data as a way to measure the support areas as well as the resistance areas of the market. These areas tell the traders at what price level buyers enter the market and make purchases and at what price level sellers acquire profits. The average high is the resistance area. The average of the low is the support area. The high moving average contains ten bars, and the low standard includes eight.
The Presented Moving Average High Low Indicator is a powerful tool used by traders to identify trends in the market and create a channel based on the moving average high and low prices. It effectively determines trading opportunities and makes informed decisions based on the market’s price action.


Download Moving Average Channel Indicator MT4!
High-Low Moving Average Indicator or High-Low channel represents a forex trading indicator where the moving average is applied to a bar’s high or low prices instead of a bar’s close price. Instead of one moving average line, traders will have two moving average lines on a chart where one represents the High Moving average, and the second is the Moving average applied to a bar’s low price.


Presented Moving Average High Low Indicator create a channel based on moving average high and low prices:
Download the Moving Average High Low Indicator
Moving Average High Low Channel Indicator Inputs
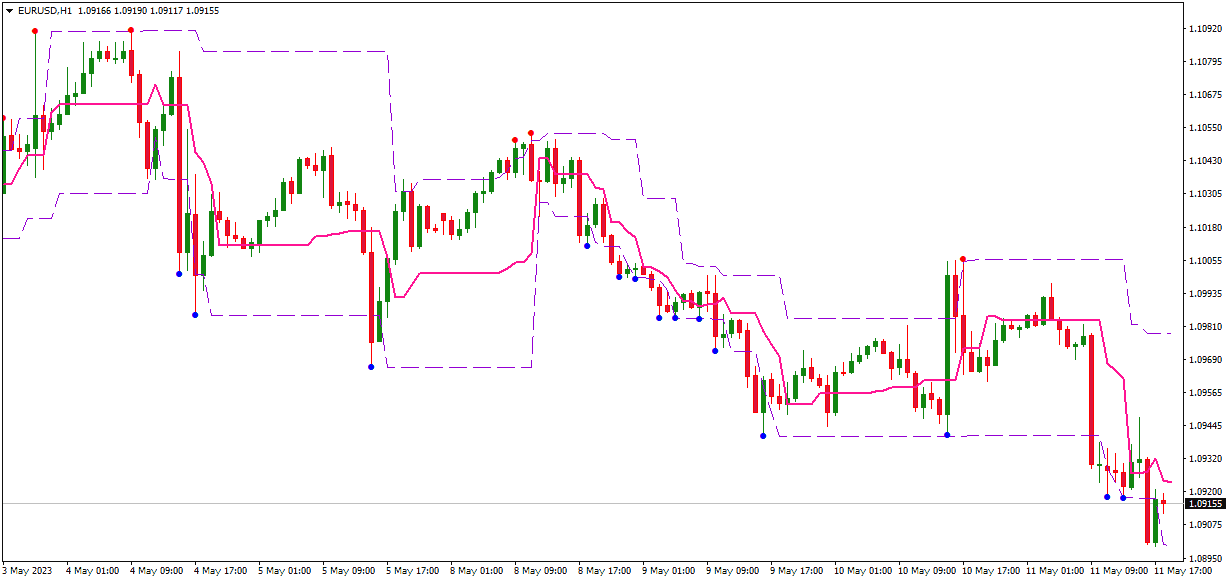
The indicator is comprised of several key components, including trend lines or channels represented by orange and blue dash lines, reversal bars marked in red and blue, a tango line denoted by a pink line, a moving average of the tango line indicated by a magenta line, and BSI value represented by a red dot line.

The trend lines or channels are used to define the market’s overall direction. The orange dashed line represents the trend line or channel high, while the blue dashed line represents the trend line or channel low. These lines help traders identify the range of market movement and help them anticipate potential price movements.
The reversal bars marked in red and blue signal potential reversal points in the market. These bars are used with the trend lines or channels to provide a complete picture of the market’s movement. Traders can use these reversal bars to determine when to enter or exit a trade and limit potential losses.
The tango line, represented by a pink line, indicates the entry-level. This line is usually placed at the center of the channel and is used to help traders identify potential entry points. For example, traders can use the tango line to determine when to enter a trade and where to place their stop-loss orders.
The moving average of the tango line, indicated by a magenta line, is used to smooth out the market’s price action further and help traders identify potential trends. The moving average is calculated over a specific period of time and is plotted on the chart as a line.
Finally, the BSI value, represented by a red dot line, is another critical component of the Presented Moving Average High Low Indicator. The BSI, or Bullish Strength Index, is used to calculate the bullish or bearish sentiment of the market. Traders can use this value to help them make informed decisions about the market’s direction and potential trading opportunities.
Make high-low moving average channel manually.
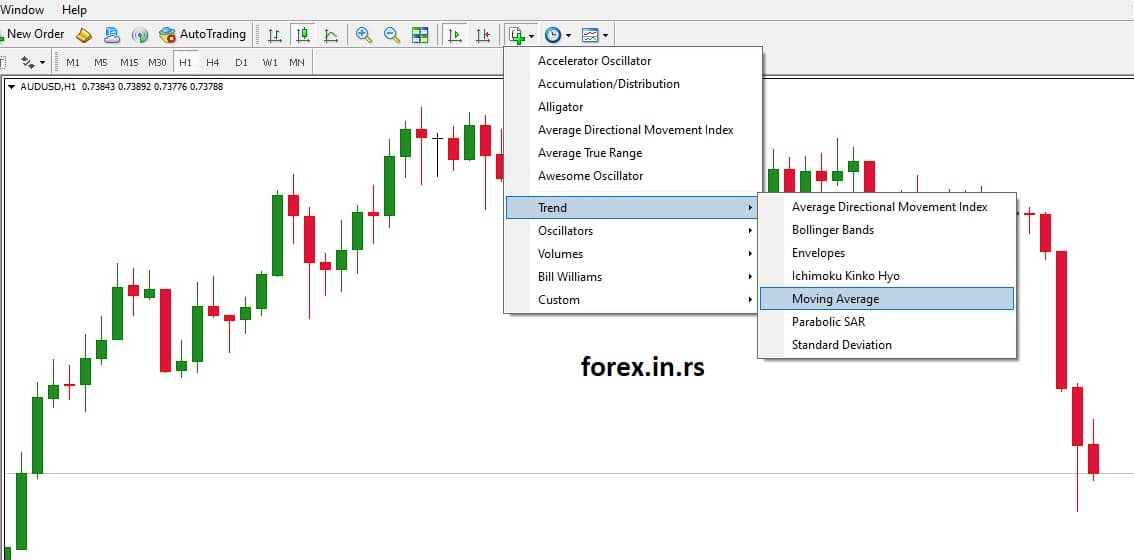
Traders can add a High-Low Moving Average indicator as same as regularly choosing indicators in the section Trend/Moving Average like in the image below:
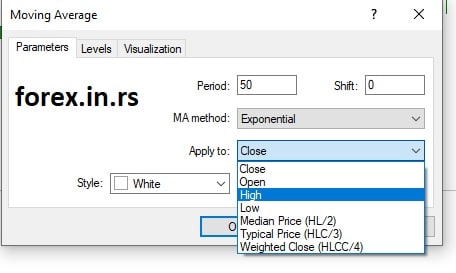
In the next step, traders need to change the setting to Low or High :
Since this is a system that changes, a person can alter the guidelines of the trading system. For example, some traders prefer to buy and sell breakouts above or beneath the resistance or support areas. Others tend to use the resistance and support areas to build a market position that influences the market trends.
Usually, the high-low average isn’t a system that can be crossed over. Instead, the system creates a channel. This channel goes around the bars on the price chart. When a market is experiencing a strong trend, the price may trade past the channel. As a result, the price will go above or below the price chart. A trader might use the break from the channel as an indicator to build a market position that compliments it. A solid break or an escape from a price channel may signal that a trend is forming. A break outside the channel countering the underlying trend may indicate a contrarian entry signal.
High Low Moving Average Channel
Most famous traders use several moving averages to watch breakout moments, watch trends, and how strong a trend is.
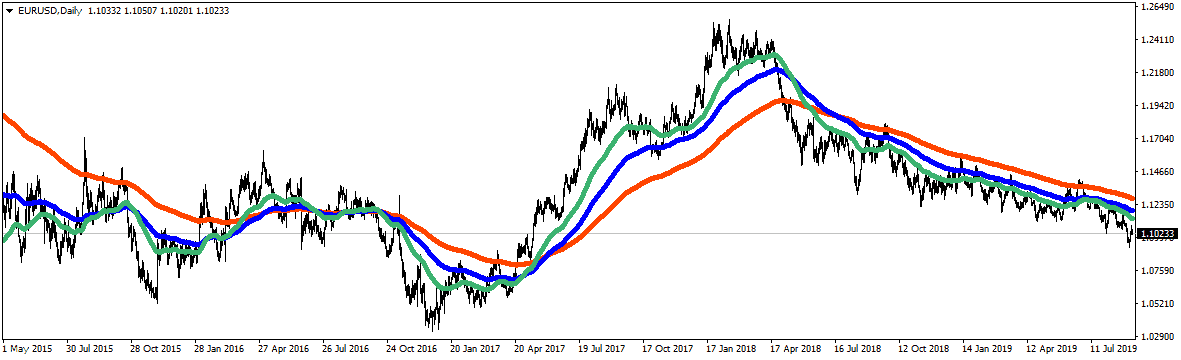
On the chart above, we have 3 moving average channels. We have EMA 50, EMA 100, and EMA200 moving average channels. If we see a significant change in trend, the price will move from the above/below channel to the below/above channel.
Other combinations for High Low, Moving Average channels are :
EMA 50, EMA 100 and EMA200
SMA8, SMA21, and SMA89
SMA13, SMA21, and SMA55
The high-low changing average utilizes several different properties. Period 1 is the distance of the first moving average using a default value of ten. Period 2 is the distance of the second average. Its application also uses a default value of ten. Aspect 1 is the symbol field the study will compute o; this application utilizes a high default. Aspect 2 is the symbol field on which the study will be computed; this application uses a low default. The high-low average combines these several different types of analysis into one single indicator. The high-low-average research can also be used to find the volatility. When the volatility is up, the channel has widened, while the volatility down indicates that the channel has narrowed.
This measurement can be combined with other measures to calculate prospective entry points. The high-low moving average is an excellent tool for binary and non-binary traders. The tool provides over five types of trading indicators,s making it simple and easy for traders to know exactly when to buy and sell their stocks. The high-low moving average is simple enough for newbie traders to calculate. However, its data is reliable enough to be a favorite tool for seasoned traders. This quick and easy study will provide most of the trader’s data for their market analysis.
Conclusion
Overall, the Presented Moving Average High Low Indicator is an incredibly effective tool for traders looking to identify trends in the market and create channels based on moving average high and low prices. By utilizing its various components, traders can make informed decisions about when to enter or exit a trade and limit their potential losses. As a result, it is a powerful tool that can help traders succeed in their trading endeavors.

He is an expert in financial niche, long-term trading, and weekly technical levels.
The primary field of Igor's research is the application of machine learning in algorithmic trading.
Education: Computer Engineering and Ph.D. in machine learning.
Igor regularly publishes trading-related videos on the Fxigor Youtube channel.
To contact Igor write on:
igor@forex.in.rs
