Table of Contents
As a forex trader, you may have imagined the most important levels for support and resistance when you are trying to analyze CFDs, Forex, or commodity instruments, right?
Well, not every support and resistance level can have the same kind of situation. A few are essential to know about the breakouts, while the others are important to know the reversal trends. In today’s piece, we will talk about the key support and resistance levels for forex, which is the most reliable and easiest to implement in various trading situations.


What are forex levels?
Forex levels represent the price levels of currency pairs and can be of different significance to traders. Important forex levels are usually price levels determined by previous highs and lows, trendlines, channels, and indicators.


Each price level has a different impact on trading. We will analyze the most important price levels.
Key levels forex
Key forex levels are the most important price levels that traders use to enter a position or exit from a trading position. Usually, the most important price levels in trading are former support and resistance levels (former high and low levels), Fibonacci levels, Pivot point levels, price levels on trendlines and channels, etc.
In the next step, we need to define support and resistance as the most important key levels in trading.
What is support in forex?
Support represents a hypothetical price level or price area supporting, or holding up, prices and signifying more forex buyers than sellers. Support is often viewed as a “price floor” because traders hypothetically expect that price change direction and begin to rise based on past performance.

Key Level Forex Strategy – Advanced Traders Cash FX Strategy
What is resistance in forex?
Resistance represents a hypothetical price level or price area consolidating, declining new high prices, and signifying more forex sellers than buyers. Resistance is often viewed as a “price roof” because traders hypothetically expect that price change direction and begin to fall based on past performance.
What Are Support and Resistance Levels in Forex?
Support and resistance levels in forex trading are hypothetically determined price levels based on past performance. Usually, previous close prices, the previous high, and previous low prices are key support and resistance levels in forex. For example, in a bullish market previous weekly low can be strong support for the current week of trading, or in a bearish market, a previous weekly high can be strong resistance for the current week of trading.
Usually, traders in reports instead support and resistance levels talk about supply and demand zone. Sometimes it is tough to define one level as resistance or support level, so the whole area gives a better edge to traders.
How to find support and resistance in forex?
To find and draw support and resistance on the forex chart, traders need to define all-important price levels on the current chart, such as daily low, daily high, weekly low, weekly high, monthly low, monthly high, yearly low, yearly high, etc. The trader can then add Fibonacci levels, or Pivot points, or any important level based on experience and trading style. Usually, in a bullish trend previous resistance level can become the future support level and vice versa. There are always several support and resistance levels on the chart.
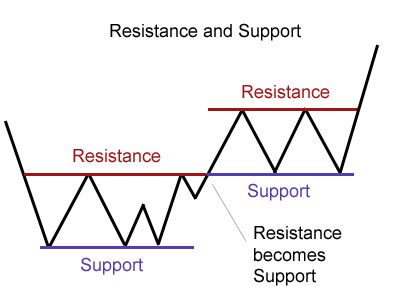
Now let us see forex charts with support and resistance levels:
Forex chart with support and resistance levels
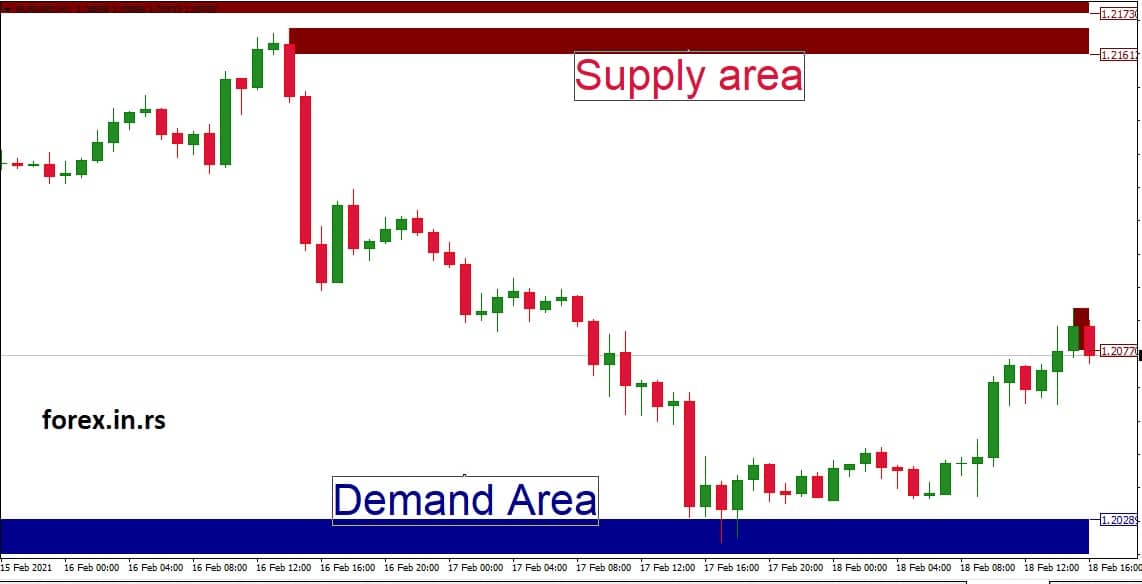
Supply and demand levels in forex
Support signifying more forex buyers than sellers, and usually, traders call this level a demand level. Resistance signifying more forex sellers than buyers, and usually, traders call this area a supply level. Supply and demand levels in forex are based on key support and resistance levels in forex. However, supply and demand zones are drawn as the area on the chart rather than level.
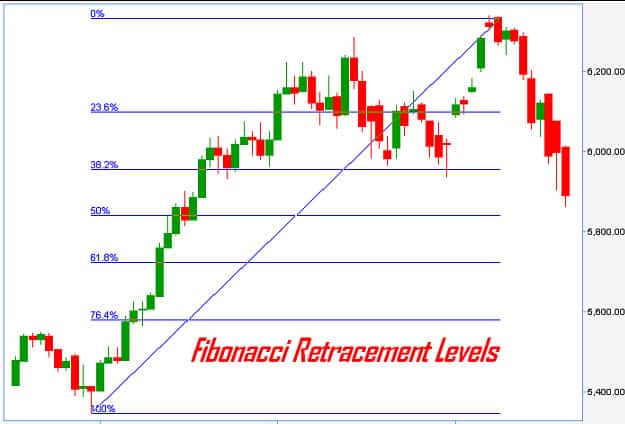
Fibonacci levels in forex
Fibonacci levels in the forex represent horizontal lines that indicate the possible support and resistance price levels determined based on the Fibonacci sequence. The sequence is formed by taking 2 numbers, any 2 numbers, and adding them together to form a third (1,1,3,5,8,13…). Fibonacci levels are determined based on previous high and low prices, where each level is associated with a Fibonacci sequence percentage (0%, 23.6%, 38.2%, 61.8%, and 78.6%).
The Purpose of Support & Resistance
S&R offers a crucial summary of the most relevant levels in the market and charts for analysts and traders. Bouncing spots from the past are produced from these S&R regions. Basically, the price enters a place where it reverses in the opposite direction, producing a level of S&R in turn. In technical analysis, S&R levels and trend and price trends are a widely used feature. Below, the seven key advantages of using S&R zones are summarized. The following are the functions of support and resistance.
- To measure breakouts
- To Identify reversal or bounce.
- To trade bounces
- To trade breakouts
- To avoid confluence in your trading analysis.
- To avoid weak support and resistance setups.
- To find targets
Various Types of Support & Resistance Levels
All the different support and resistance levels are useful, but as per the trader’s preference, he selects any 1-2. The main three levels of support and resistance are as follows.
- Dynamic support and resistance levels
- Fixed support and resistance levels
- Semi-dynamic support and resistance levels
What are Dynamic Support and Resistance Levels?
S&R areas are complex levels. The support and resistance level are reassessed any time a new bar, candle, or some other price unit appears on the graph, and a dealer will implement the new level for their judgments and not the previous one. Moving averages, the Admiral Keltner Channel, the parabolic, the Ichimoku, etc., are examples of complex S&R scales.
What are Fixed Support and Resistance Levels?
Fixed levels can be said to be non-changed S&R regions. Until the price breaks through, they stay true at the same rate. Examples of set ranges include round levels, tops and bottoms, annual rises & lows, highs & lows of candles, and candles’ opening & closing. These amounts do not vary; no matter if the rate moves, they stay the same. 1.10 will remain around the level of 1.10, which will not change to 1.1050.
Bear in mind that all S&R stages are rough areas. Although it would not modify the round degree of 1.10, the impact is not only visible at 1.10. In reality, at levels such as 1.0975 and 1.1025, the price will now reverse and jump around, close to 1.10.
What are Semi-dynamic Support and Resistance Levels?
The support and resistance levels lie between a fixed and a dynamic level. Although dynamic levels change at various rates and fixed levels stay stable, semi-dynamic support and resistance change at a steady rate. The trend line, which varies at a constant rate per candle, is a great instance of a semi-dynamic support and resistance stage. If it is located at an up or down point, the trend line will travel in that path at the same rate with each new candle. Fibonacci thresholds (the trader can shift that) and Pivot Points are some other instances.
The key distinction among the dynamic and semi-dynamic levels lies in that semi-dynamic levels shift only at a constant rate per candle. In contrast, at a non-fixed value, dynamic levels change. The S&R levels may either be programmed or drawn manually on the map, depending on the system used. The Fibonacci retracement method has to be developed explicitly by the trader on the graph. Simultaneously, the MT4 or MT5 system automatically measures a moving average after being applied to the graph.
The Useful Method to Use Support and Resistance Levels
How to trade support and resistance in forex?
Support and resistance are price levels that can be used as entry position or exit position in trading. For example, the current buy trade trader can set the stop loss the same as the previous low ( for example, monthly low). The target for buy trade can be former resistance (for example, last month’s high).
For various reasons, you should use S&R ranges on different time frames. While traders may use many more timescales as they choose, dealing with three charts is generally the best way. It also gets ambiguous in more than three time periods, and fewer than three graphs have less depth and perspective. Let’s split the three timescales into the higher, middle, or lower element methods because the three-times frame utilization depends largely on what kind of trader you are. Rationally, a long-term trader would use a very different chart compared to an intra-day trader.
| A Long-term trader: | Higher term: Looks at the monthly chart | Middle term: Looks at the weekly chart | Lower term: Looks at the daily chart |
|---|---|---|---|
| A Swing trader: | Higher term: Looks at the weekly chart | Middle term: Looks at the daily chart | Lower term: Looks at 4-hour chart |
| An Intra week trader: | Higher term: Looks at the daily chart | Middle term: Looks at 4-hour chart | Lower term: Looks at 1-hour chart |
| An Intraday trader: | Higher term: Looks at the daily chart | Middle term: Looks at 1-hour chart | Lower term: Looks at the 15-minute chart |
| A Scalping trader: | Higher term: Looks at 4 hours and/or daily chart | Middle term: Looks at the 15-minute chart | Lower term: Looks at the 5-minute chart |
The higher timescales are the most appropriate for identifying crucial thresholds powerful enough to deter the continuity of a pattern or impulsive market behavior. These are the prices a trader must monitor for possible reversals and targeting usage; however, when the price is close, they must be vigilant when dealing at these levels.
The middle timescales are more fitting for the pattern, or tops & bottoms within a set, to locate continuations or breakthrough spots. These levels are not as high, strong, and relevant as the higher time span of support and resistance levels and are better used for jumps at retracement levels or pattern breakouts.
Lower timescales are less efficient than those in the medium time range and are better used mainly to trade breakouts. Traders will trade breakouts above or below thresholds, both for and against the pattern, or breakouts.
When the price breaks in the lower time frame from a support and resistance stage, if the broader analysis indicates that a larger turnaround is feasible or probable, it may be used for a turnaround setup.
Support and Resistance Tools
For support and resistance instruments, each trader would have its own personal interests. Just Fibonacci levels can be used by some traders, although some may use a combination of pivot points and moving averages. Simply put, no answer is correct or incorrect.
The best approach is to identify the S&R tool or devices that fit best with your trading philosophy and your method and trading process. The tastes are very personal, which is why it makes sense to test the support and resistance levels for a few days or weeks. Since an S&R method could work well for one individual, it could work well with you too.
There are various changes for selecting an S&R tool as per your preferences.
Testing and Trying
Start opening as many S&R instruments and metrics as you want and check them out. Here, there seem to be no restrictions since you can playfully explore and work on all the various stages of S&R. There are several metrics available, so use your time to review them all out and note away from the things that seem to be the most significant.
Research Your tools
take time to understand them in even more depth after you have summarized the tools and indicators that are the most amusing to you. Make sure you do your study so that you understand all the principles and opinions behind those. Please ensure that any theories correlated with them are verified.
Practice and Test the Tool or Indicator
Until you have trimmed down the list to only a few and are more experienced in learning the S&R instruments and indicators, it’s indeed time for the next step, which would be to practice and measure these S&R instruments. Aim to develop a greater sense of and awareness of the approaches that fit best for certain stages of S&R.
Make Your Judgement
Select the S&R instruments that fit best with your investment strategy, dynamics of trading, and your allotted time.
Integrate it into Your Trading Strategy
You have to ensure that the S&R tool is completely incorporated into your trading strategy after the evaluation process has been completed, so ask these questions:
- Have you understood the support and resistance totally?
- Is the S&R tool fully understood?
- How are you planning to implement it?
- Have you cleared the goal of using S&R tools?
- When are you planning to use it?
This way, you will be able to identify your preferences in support and resistance, and indicators. Along with this, a few more tools are quite famous, as stated below.
- Moving averages
- Fibonacci
- Trend lines & channels
- Round levels
- Fractals, tops & bottoms
- Pivot Points
- Price bands
The Bottom Line
Each trader must pick the ideal methods, ideas, and support and resistance measures that aid and improve their trading in one of the most efficient ways. This will differ greatly from one trader to another, for instance. Thus, it is crucial to test the different S&R instruments and indications and then identify the ones that fit your style. There seem to be three tool groups that include dynamic levels of S&R, semi-dynamic levels of S&R, and fixed levels of S&R.
Please remember that S&R ranges are best seen in three distinct time frames as they are introduced with specific strategic objectives, including highest, middle, and lowest time period graphs. For detecting rebound or reversal spots, calculating breakouts, dealing in breakouts, trading swings, finding goals, preventing poor setups well before S&R, and including confluence to your assessments, S&R values are essential.
This article does not include and should not be understood as investing guidance, investment decisions, an offer, or a proposal for any financial product transactions. Please notice that, as conditions can shift over time, any such trading review is not an accurate predictor of any existing or potential results. To ensure you consider the risks, you can obtain guidance from an independent and professional investment or trading advisor before drawing any conclusions.

He is an expert in financial niche, long-term trading, and weekly technical levels.
The primary field of Igor's research is the application of machine learning in algorithmic trading.
Education: Computer Engineering and Ph.D. in machine learning.
Igor regularly publishes trading-related videos on the Fxigor Youtube channel.
To contact Igor write on:
igor@forex.in.rs
