Table of Contents
Trading is all about predicting the future course of the prices. If you are right about the price movements, you will become a successful trader without a doubt. Candlesticks are patterns that can help you with them. There are 16 common candlestick patterns that you can use to spot trading opportunities but before that, let’s read more about candlesticks.
What are Candlesticks?
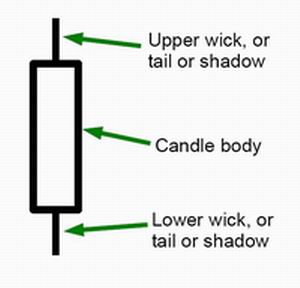
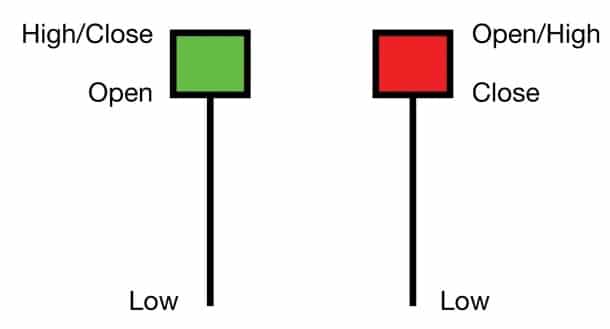
Candlesticks represent a type of price chart that displays the high, low, open, and closing prices of a security for a specific trading period. The Candlesticks Body represents the price range, open-to-close. The wick or the shadow shows the highs and lows.


Just like the name suggests, candlesticks have wick-like protrusions that tell you about price movements. A candlestick is used to display information regarding an asset’s price movement in the form of a diagram. Candlestick charts are highly beneficial in technical analysis. Even by looking at a few price bars, you can quickly interpret an asset’s future price movement.
The colors on this chart are very prominent and help you identify the market direction. The green/white body represents an increase in the price, and the red/black body stands for a decrease in the price.
As time progresses, these singular candlesticks form patterns that allow traders and investors to assess the strength of support and resistance levels. Different candlestick patterns tell you about different stimulations taking place in the market. You can know about the buying-selling pressure, market indecision, continuation patterns, and more. We will discuss more of it in this article.
Visualizing the Candlestick Chart
The candlestick chart’s main component is the candle itself that consists of a body and one or two wicks. The body’s shape, the wicks, and the colors help traders determine the market movements.

While Steve Nison favored candlestick charts, he strongly advocated the traders to follow a triad approach. A triad approach includes reading a chart like a candlestick chart with other technicals. It has a relative support line, strength analysis, horizontal resistance, and, one of the most important, moving averages. One must also consider the risk-reward analysis through trade management and capital preservation.
Candlestick charts have always been popular in Japan and remain the preferred charting technique. However, it took candlestick charts over two centuries to reach the Western hemisphere. While the journey might have been long, these charts gained popularity quite rapidly. Within a quarter-century, these became the first choice of everyone engaged in Wall Street and Main Street.
Candlestick charts facilitate technical analysis. These charts date back to the 18th century, when used in feudal Japan to organize the rice trade. By the early 1800s, these charts into organized candlestick charts. These candlesticks were introduced to the west by the founder of candlescharts.com, Steve Nison, in 1989. He wrote about these charts for Futures magazine. He was working with Merrill Lynch at that time.
Candlestick charts are very comprehensive and appeal to technical analysts for various reasons, their visualization being the primary factor. These charts clearly show the key turning points of the market. By understanding the basic 16 patterns, you can quickly know about the market directions. Key reversal patterns have proper names. They allow traders to know exactly what they can expect—for example, morning and evening star candlestick patterns for bullish and bearish markets, respectively.
These charts are very flexible, which is another thing that technical analysts appreciate. These can be used in any market and time frame. All you need is a price for an open, close, high, and low.
If you are not yet familiar with candlesticks, it is better to learn their basics first. Only after you have familiarized yourself with every component and pattern would you make a viable strategy. You can start by practicing on demo accounts. Enter and exit trades by using signals given by these charts. You will see how accurate your calculations are, and you will not be losing real money.
While candlestick patterns are great, and you can use them for predicting trends quickly, it is never advised to use them alone. Instead, back them up with other technical analyses. This will eliminate vagueness and help you in confirming the trend.
2 Bar Reversal Pattern
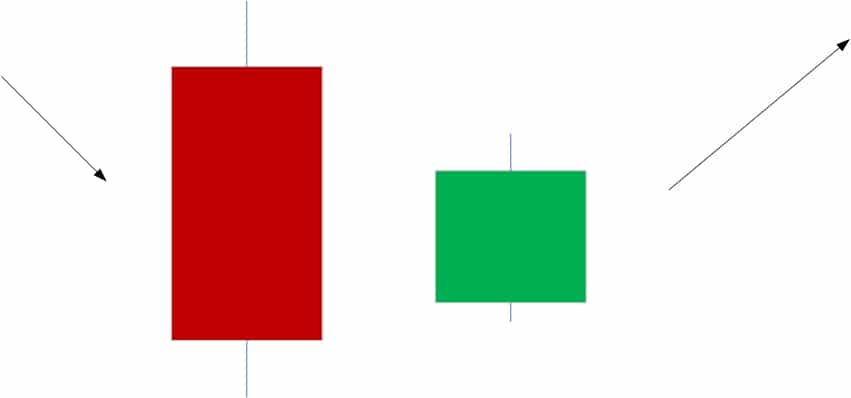
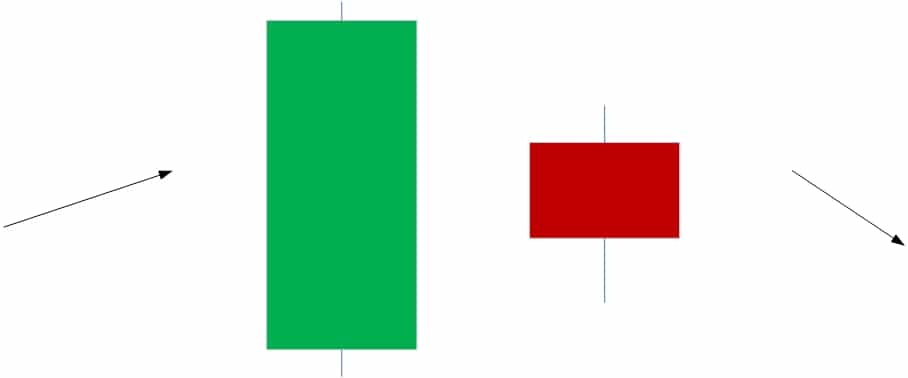
Two bar reversal patterns are patterns that show momentum weakening and indicate a trend reversal. The most used 2 bar reversal patterns are engulfing patterns, harami, hook reversal, etc.
You can read more about these patterns in the following chapters of this article.
Candlestick patterns are deemed an essential aspect of trading. Many patterns tell traders and investors about the price action. These can be bullish or bearish. 2 bar reversal pattern is one such Price Action formation. You can find it across the markets at any time frame. As a Price Action signal, this chart pattern is used to identify trend reversals. As a reversal signal, traders often employ it to form pullbacks.
A two-bar reversal pattern is quite similar to the Pin bar reversal pattern. The main difference is that it uses data from 2 sessions; however, the psychology behind the two is not different. Both the patterns are used to look for prices that move in one direction and snap in the opposite direction quickly before some faking traders are out.
2 Bar Reversal Trading Strategy
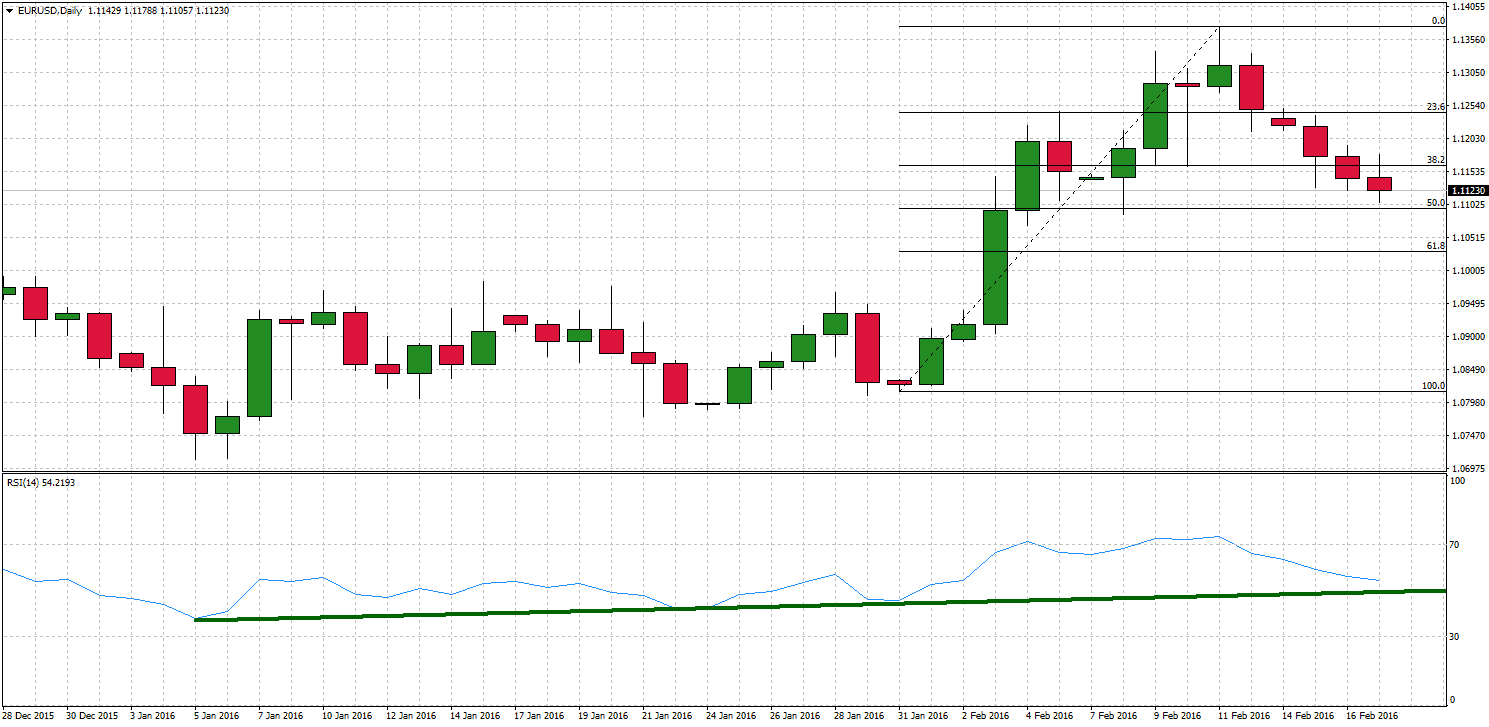
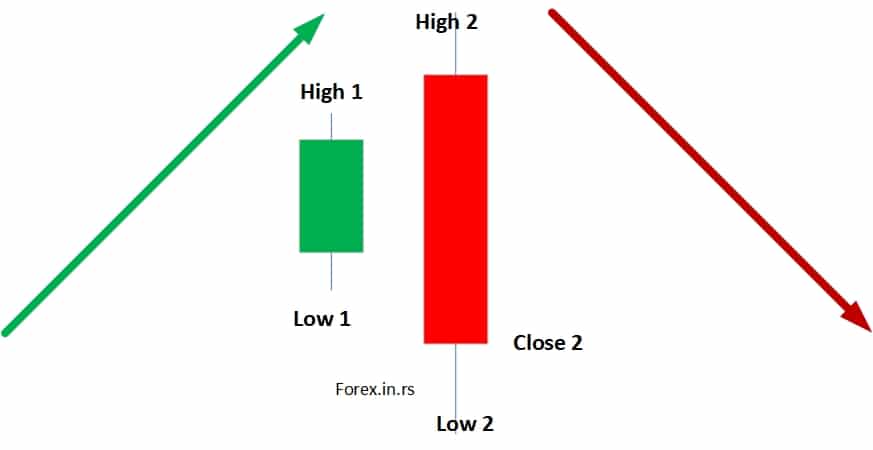
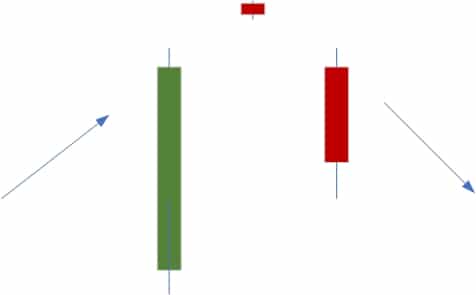
The 2 bar reversal strategy usually implies entering the trade after the second bar closes and using stop-loss defined with high or low from the first two bars. For example, BUY after the second candle closes (Close2) if the pattern is engulfing bullish pattern, and put stop loss equal to the lowest low level (Low2).
To understand this bar reversal trading strategy, it is essential to understand its structure. The pattern consists of 2 bars or candles. Traders can use this pattern to detect both bearish and bullish trends. For example, in a bearish trend, the first bar moves upwards and close s near the session high. Simultaneously, the second bar or candle must open, snapping back lower to reject previous faking traders and highs.
When you feel that the market is going strong and hoping for a pullback is logically and analytically expected, you can wish for the best two-bar reversal pattern formation. You will find them in the logical resistance or support areas. These areas of demand and supply are sought after by traders to look for this particular bar formation as it signals the point when the traders can enter the trend.
Where is the Pattern Applicable?
The 2 bar reversal pattern is very versatile as it can tell you about both the bearish and the bullish trends. Moreover, it could be used in any of the markets. However, since these are reversal signals, these are most likely to act as the catalysts that change the trend direction.
Identifying Strong Trends with a 2 Bar Reversal Pattern
Identifying Price Actions using this chart is relatively easy for anyone using this pattern. One thing that needs to be kept in mind is that just because you saw something on your chart doesn’t mean you have to act upon it. It must also be noted that not every 2 bar reversal is equal. These are created differently and can show different results.
Frequently Asked Question
Q1. Explain the meaning of a reversal bar.
Reversal bars consistently exceed the lows and highs of the preceding bars. They also close lower or higher than the last bar of the opposite direction.
Q2. What do you mean by a bearish bar reversal?
When a reversal bar exceeds the high of the existing bar, it is called a bearish bar. However, it also needs to close lower than the previous bar’s close.
Q3. How are inside bars traded?
Inside the bar, trading refers to trading done while the bar is still not correctly formed. This tool is often used by traders who wish to enter the trade on the current bar’s wick. This can be a powerful tool if your moves are correct. The best way to capitalize on it is by looking at the bar and the price chart simultaneously. You can have both charts present on the screen at once. Only make sure that the time frame of the price chart is lower.
Reversal candlesticks
Reversal candlesticks are trading patterns that suggest a possible change in future trends, trend reversal. Usually, strong price movement in a different direction than the primary trend is the first sign of trend reversal.
Strongest Candlestick Reversal Patterns are:
- The Magic Doji
- Abandoned Baby
- Engulfing Patterns
- Hammer
- Hanging Man
- Harami
- Stars
Bullish Candlesticks reversal patterns are:
- Hammer
- Inverse hammer
- Bullish Engulfing
- Piercing Line
- Morning star
- Three White Soldiers
Bearish Candlesticks reversal patterns are:
- Hanging Man
- Shooting Star
- Bearish Engulfing
- Evening Star
- Three Black Crows
- Dark Cloud Cover
Continuation Candlestick Patterns
- Spinning Top
- Falling Three Method
- Rising Three Method
- Spinning top
Identifying the Strongest Candlestick Reversal Patterns
There are some basic reversal candlestick patterns that traders must learn. Steve Nison Japanese Candlestick Charting Techniques also has these charts. You can find the same on his website too. Some of the popular ones are explained below:
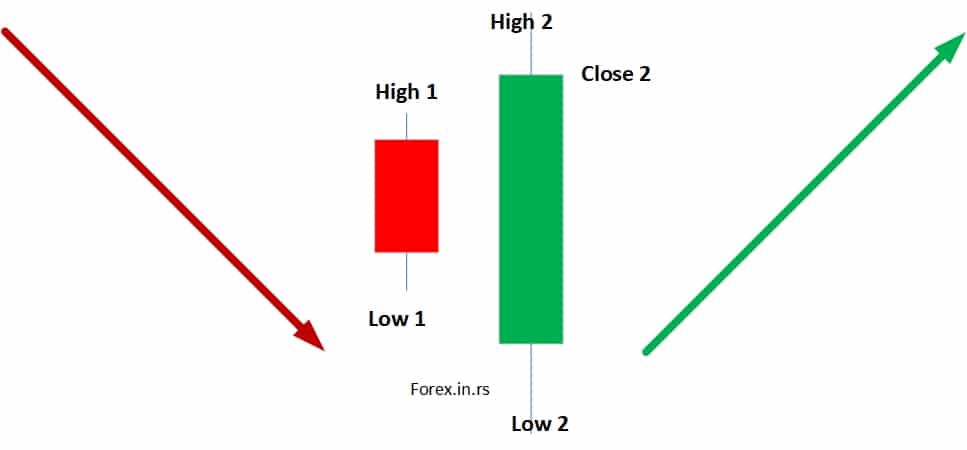
1. The Magic Doji
Doji is a Japanese word that translates to ‘at the same time.’ There are two candlesticks in this pattern that tell you when you can expect the closing price to be almost the same as the opening price. This pattern is regarded as a significant individual candlestick pattern. This pattern can also play a crucial component in various multiple candlestick patterns.
You can use the Magic Doji to check if the market is indecisive. If this pattern appears to post an uptrend, sometimes following a white long-bodied candle, you can say that indecision is very high. This is the time when bulls should have been decisive. On the other hand, this pattern also indicates an equilibrium in the market concerning demand and supply. In both cases, the pattern hints towards the end of an uptrend.
Similarly, if the pattern appears after a continuous decline, you can expect the downtrend to be ending.
When the close and open are at a low, you will see a Gravestone Doji. This position calls tops even though this formation is found at the bottoms. It is a crucial reversal candlestick pattern.
2. Abandoned Baby
This one is a rare three-candle pattern. It is used in defining the bottom. A relatively long-bodied candle follows the current trend. The second candle, which follows the current trend’s direction, shows the price gap that opens above or below the last day’s close. When it comes to the previous candle, the price gap moves in the opposite direction of the trend.
The second candle’s shadow is not supposed to overlap with the shadow of the remaining two candles.
Wouldn’t you feel abandoned if you sold your asset during the middle candle? You would feel abandoned by the market and would want to leave the position. The chartists in the west call it ‘island reversal.’
3. Engulfing Patterns
There are engulfing patterns for both the bearish and bullish markets. Engulfing patterns are among the strongest candlestick reversal patterns. Thus, you can know about the possibility of a significant reversal at the extremes.
The bearish engulfing has a white candle. The prices gap is higher with every recurring open. They make a new high before pulling and turning intraday to close under the previous session’s bottom. This shows that bears are in power. They have sent the bulls into a retreat after counterattacking their final thrust.
This is known as ‘key reversal’ in the west. It is easier to identify the reversal in a chart.
4. Hammer
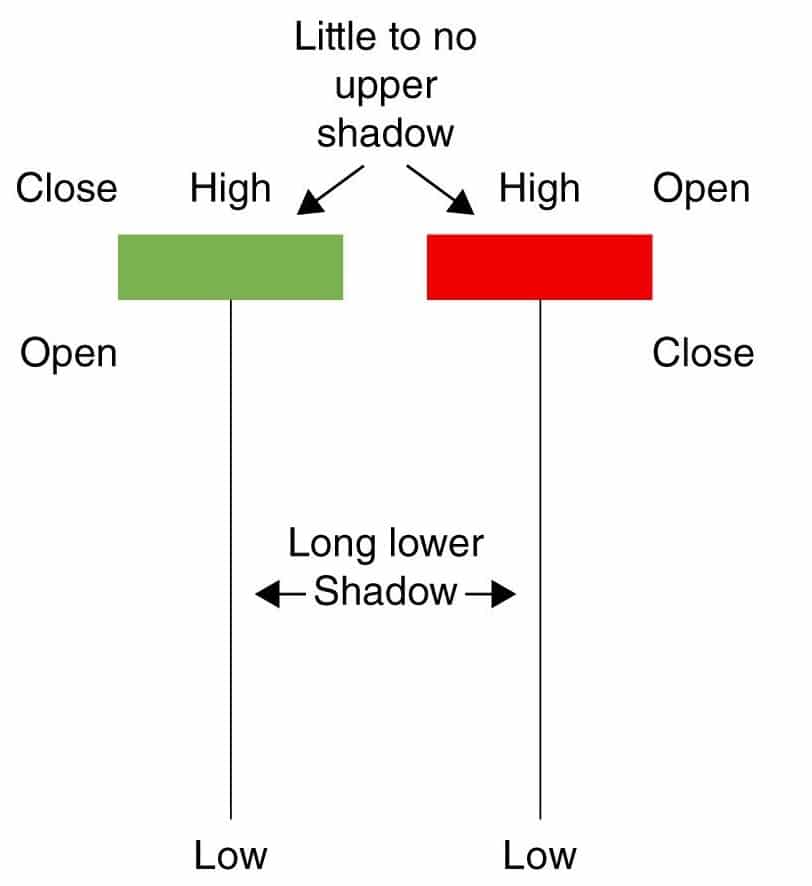
Hammer is one of the most common candlestick reversal patterns to be used by traders across the world. Hammer candlestick pattern has a small body with a no or negligible upper wick. The lower wick, however, is considerably long and makes a new low. Therefore, while the color may not be defining, a whistle candle is considered more bullish. In this case, the lower wick needs to be at least twice the height of the body.
In Japanese folklore, a rabbit makes rice cakes using a wooden hammer with a long handle; the Japanese consider this pattern to suggest that the bulls get more robust and soon hammer out a base.
5. Hanging Man
The Hanging Man candlestick pattern can be regarded as the Hammer pattern’s bearish equivalent (bullish signals). This pattern looks like the Hammer pattern as well. As it appears after a rally, it takes the form of a bearish reversal indicator.
It is more bearish if the body is slightly filled in, though it is not always the case.
The lower wick is again longer than the body and signifies the vulnerability of the prices. It tells traders that the underlying support may not be strong enough to lead to a quick sell-off.
The bearish signal is confirmed by the close below the hanging man’s body during the next session. The patterns resemble a man hanging from a high level, hence, the given name.
6. Harami
Harami means pregnant in old Japanese. There are two candles in this pattern – one is a small candle resembling a fetus, and another longer one represents the womb. The smaller candle can fit entirely inside the last session’s long body.
It is a reversal candlestick pattern, though not as popular or used at the reversal patterns like Engulfing, Hammers, and the Hanging Men. Yet, it is essential as it can tell traders when the prices will separate from the previous trend.
7. Stars
These candlestick patterns have three candles and look like the Abandoned Baby pattern. In addition, there are two-star candlestick patterns, Evening Star and Morning Star.
Evening Star follows an uptrend. The first long and white candle is followed by a small-body candle and a third long and filled-in one. The second candle has a long lower wick that can overlap the body of the third candle. This pattern follows an uptrend and gives a bearish signal.
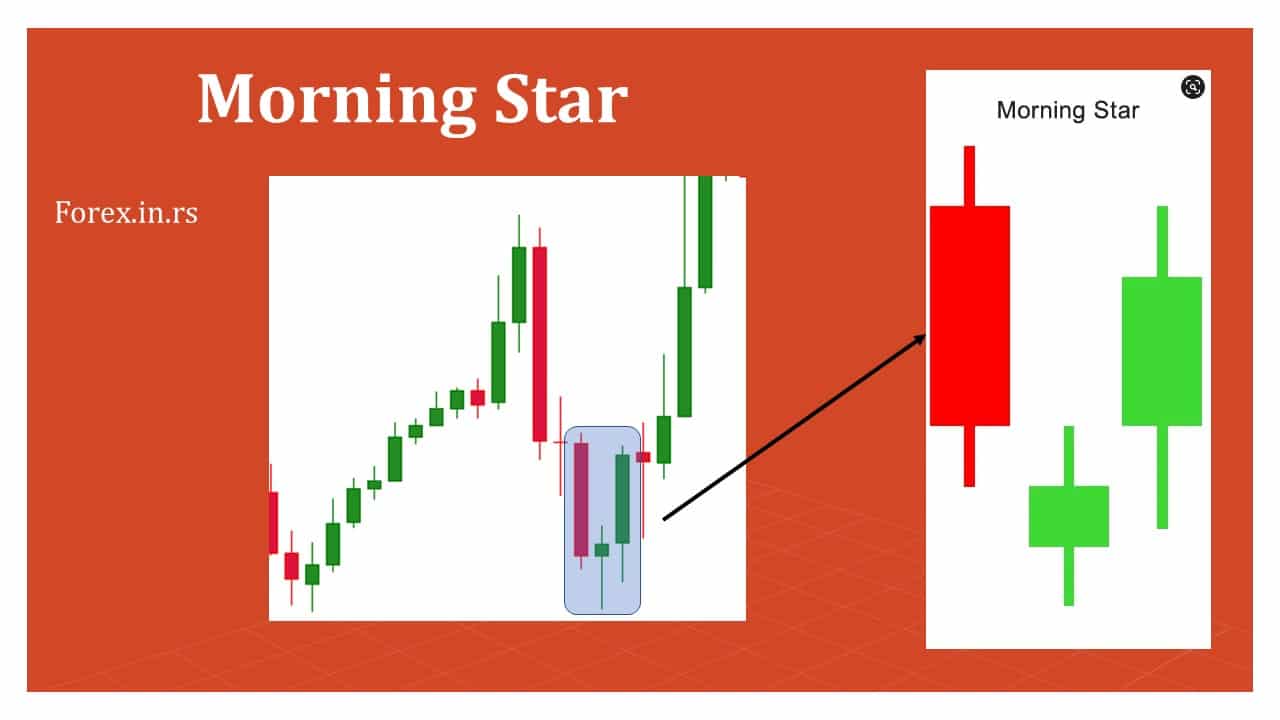
Morning Star is seen as a bullish pattern. It also has three candlesticks, but the wick of the second one does not overlap with the third one. So it shows that the bulls are getting stronger.
Nison considered star patterns similar to traffic signals. The long green candle follows the direction of the trend. It turns yellow and implies that the market is indecisive. It ultimately turns red, which shows a countertrend move.
What is Bullish Reversals Candlestick Patterns?
Bullish reversal represents a trading pattern when a downside trend on the chart begins to move in the opposite direction. Bullish reversal patterns indicate the possible future rising trend.
Your candlestick chart may show a bullish pattern after there has been a downtrend. It will also signal a price movement reversal. This condition is supportive of traders who want to open a long position. They can take advantage of the upward trajectory and make some profit. Six common candlestick patterns fall in this category. They are given as follows:
1. Hammer
A short body and a long wick, pointing downwards, form the Hammer pattern. You can find such a candlestick pattern at the bottom of a downtrend. There are two things that the Hammer pattern shows; there was selling pressure during the day, and that the prices were driven back up because of an intense buying pressure. You can have both red and green hammers – green hammers depict a more vigorous bull.
2. Inverse Hammer
This candlestick pattern is similar to the Hammer pattern. The main difference here is that it is inverted; the lower wick is shorter while the upper wick is longer.
This shows a buying pressure followed by a selling pressure that could not decrease the market prices as it was not strong enough. Thus, this pattern foretells that the buyers will soon control the market.
3. Bullish Engulfing
A short red candle, engulfed by a giant green candle, forms the Bullish Engulfing candlestick pattern. In general, the second day opens with lower prices than the first day. However, the bullish market pushes the prices up and makes the market more profitable for the buyers.
4. Piercing Line
Just like the Bullish Engulfing candlestick pattern, this one uses two sticks as well. The first one is red, and the next one is green. Both are long candles. The significant feature here is the gap between the green candlestick’s opening price and the red candlestick’s closing price. Piercing Line represents intense buying pressure. Here, the prices get pushed up above or to the mid-price level of the previous day.
5. Morning Star
The Morning Star pattern represents a reversal candlestick pattern that predicts hypothetical future price reversals to the upside. The morning star pattern consists of three sizeable bearish candlesticks, a small candle, and a large bullish candle.
It is a positive candlestick pattern, especially when there has been a downtrend. This pattern is made with three sticks: a short candle, one long red candle, and one long green candle. The ‘Star’ will not overlap with the red and green candles. This pattern shows that the first-day selling pressure is subsiding with the advent of the bull market.
6. Three White Soldiers
This candlestick pattern occurs during three days. There are three consecutive small-wick candles in green or white color. These candles progressively open and close higher than the previous day. Three White Soldiers give a powerful bullish signal that takes place after a downtrend. It also shows steady buying pressure.
Bearish Reversal Candlestick Patterns
There is usually the formation of the bearish candlestick pattern after there has been an uptrend. This pattern signals resistance. In a bearish market, the prices fall, which is not ideal for traders. They open short positions that allow them to make profits from the falling prices. Long positions are closed in this market. There are six common candlestick patterns for this category as well: These are:
1. Hanging Man
The Hanging Man is quite similar to the Hammer candlestick pattern. It has the same shape, but it forms at the endpoint of an uptrend, unlike its bullish counterpart. It shows that the day saw a significant sell-off, but the buyers pushed the prices up again. Since there is a significant sell-off, bears will control the market, and bulls have lost.
2. Shooting Star
The Shooting Star looks identical to the Inverted Hammer candlestick pattern. It is formed when there is an uptrend. The lower body is small, while the upper wick is long.
You will see a slightly higher gap on an opening day in the market that rallies to an intra-day high as the prices are about to close above the open. It looks like a star is falling, hence, the name.
3. Bearish Engulfing
This pattern takes place when the uptrend ends. A short and green candle, engulfed by a bigger red candle, forms this pattern. The Bearish Engulfing signifies a slow down or a peak price movement. It shows that the market is waiting for a downturn—the lower the second candle, the stronger the signal.
4. Evening Star
Evening Star Forex Pattern represents a reversal candlestick pattern that predicts hypothetical future price reversals to the downside. The evening star pattern consists of three candles: a sizeable bullish candlestick, a small candle, and a large red candle.
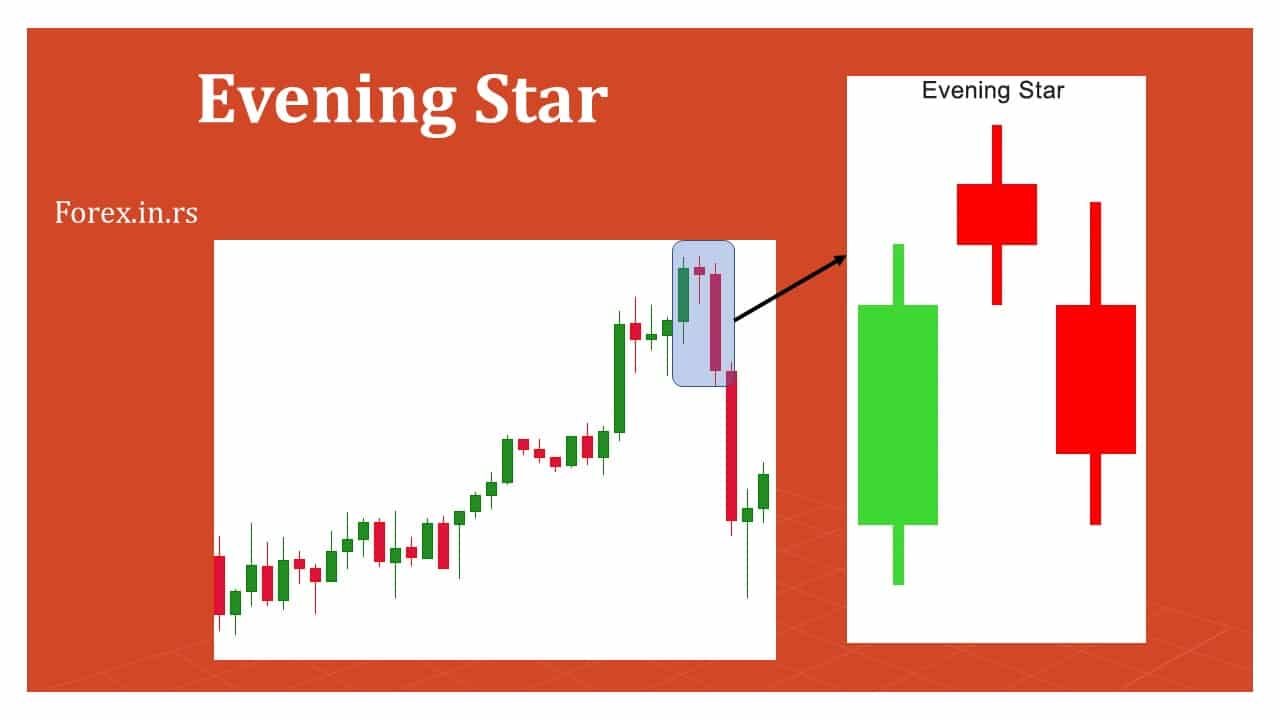
We have the Evening Star pattern for the bearish market, like the bullish Morning Star candlestick pattern. It also has, however, three candlesticks. There are two large candles, a red and a green one, and the shorter one is sandwiched between the two. This pattern shows a reversal of an uptrend. If the third candlestick is erasing the first candle’s gains, it is a strong signal.
5. Three Black Crows
You will see three consecutive standing long red candles in this pattern. The wicks are either too short or non-existent. Every session opens to the previous day’s opening price; the thing to notice is the selling pressure that forces the prices to move lower with each close. This pattern warns the traders about the upcoming bearish downtrend. This is a seller-dominated market.
6. Dark Cloud Cover
Staying true to its name, this candlestick pattern converts the last day’s optimism into pessimism. The red-colored candle opens above the green candle of the previous day but closes below the midpoint. This shows that the bears will be running the market and push the prices further lower. The short wicks of the candles show a strong downtrend.
Continuation Candlestick Patterns
We read about how candlestick patterns indicate that the market direction is or has changed. Specific patterns are not related to the market direction at all. These are known as continuation candlestick patterns. Like other patterns tell traders whether the market is bullish or bearish, these four candlestick patterns allow traders to see a rest period. This is the period when the price movement is neutral, or the market is indecisive. There are four continuation candlestick patterns:
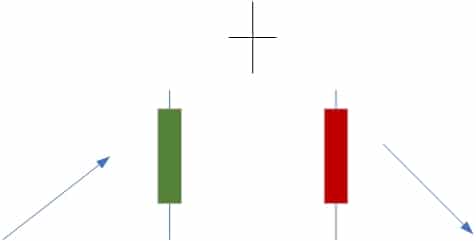
1. Doji
The Doji pattern highlights the market struggle between buyers and sellers as the closing and the opening price points are almost the same. The pattern looks like a plus sign or across. The wicks vary in length, and the candles are practically non-existent. While in singularity, the Doji pattern is a neutral signal, where none of the parties gain. It can still be spotted in reversal candlestick patterns, in partnership with patterns like the bearish evening star or the bullish morning star.
2. Spinning Top
The body of the candle and the wick are generally of equal length, both being short. This pattern forms when there is indecision in the market. The bull and the bear are at war, with the former trying to push the price higher and the latter trying to pull in lower. This pattern indicated consolidation in the market that might take place after an uptrend or a downtrend. This pattern is often used with other patterns alone; it is considered a benign signal.
3. Falling Three Method
The Falling Three Method is used to confirm if the bearish trend will continue or not. There are three long red candles, three tiny green candles, and another single red candle. This pattern shows that the bull is still not powerful enough to change the market direction.
4. Rising Three Method
This pattern is an equivalent of the Falling Three Method, but it is used for the bullish trend. There are three short, situated between two long green bodies. This pattern shows that buyers are in control of the market.

He is an expert in financial niche, long-term trading, and weekly technical levels.
The primary field of Igor's research is the application of machine learning in algorithmic trading.
Education: Computer Engineering and Ph.D. in machine learning.
Igor regularly publishes trading-related videos on the Fxigor Youtube channel.
To contact Igor write on:
igor@forex.in.rs
