Table of Contents
What Is Bullish Inverted Hammer Candlestick Pattern?
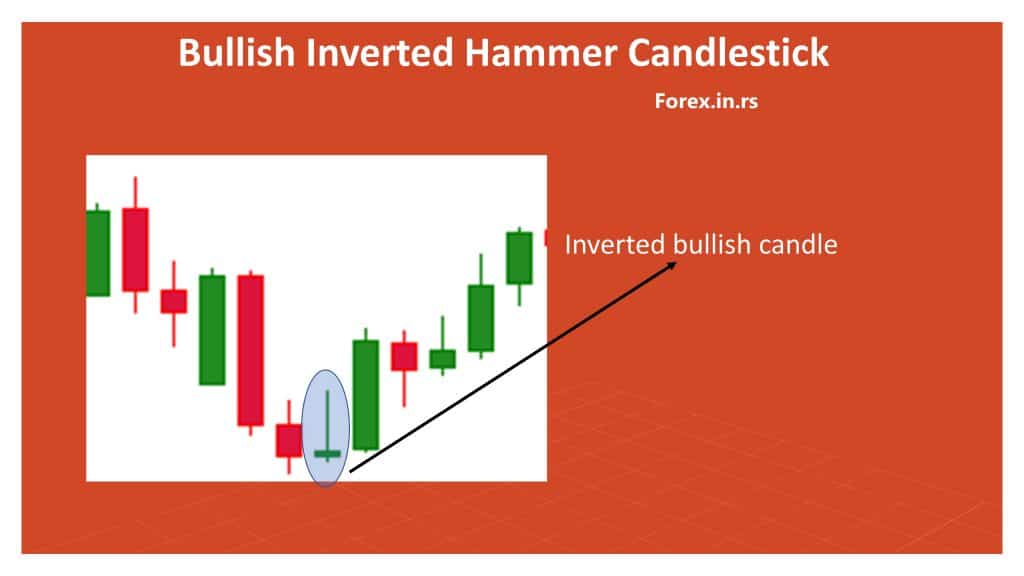
The bullish inverted hammer represents a small body candle, a long upper wick, and little or no down wick. Usually, this candle is the beginning of a bullish reversal chart pattern and indicates a future rising trend.


Best known for acquainting the traders with the market’s momentum, the inverted hammer candlestick pattern is frequently used in the forex markets. It helps in validating and knowing the potential reversals that can occur in the market. Please read this article to know what is an inverted hammer candlestick pattern, what are its advantages and disadvantages as well as to acquaint yourself with how to employ it while trading.


The structure of the inverted hammer candle can be described as having a tiny real body with an extended upper wick and a small lower wick. We generally find its presence at the bottom of the downtrend, warning the traders against a potential bullish reversal. We can understand from the extended upper wick that the bulls aim for an upward drive at the market prices.
It happens very frequently that the inverted hammer candlestick is mistaken to be a shooting star because of their similar appearance. However, even though these two patterns have a similar appearance, they stand for completely different meanings. Being a bearish signal, the shooting star is present at the top of the uptrend. On the contrary, inverted hammer candlestick being a bullish signal is always present at the bottom of a downtrend. Let us now see how to spot this pattern while trading.
How to trade an inverted hammer?
Inverted hammer traders can trade a bullish position if the inverted hammer candlestick pattern is defined:
- Bottom of a downtrend
- The small real body along with a huge upper wick and a small or possibly no lower wick
- The candle is close to the key levels of support or important price level.
After having identified the pattern, let us now learn what does the pattern denotes.

What does the inverted hammer candlestick pattern indicate:
- It denotes a reversal in the trend to the upside, which might also be understood as a bullish reversal
- It denotes a non-acceptance of lower prices at the key level
Is inverted hammer bullish or bearish?
The inverted hammer is bullish but only If the candle position is close to support or at the bottom of a downtrend. (See image above).
Why is inverted hammer bullish?
The inverted hammer near the support area is bullish because the candle shape indicated trend reversal. A long upper wick with a bullish body or doji usually indicates some change in the trend.
Positives and Negatives of the Inverted Hammer Candlestick Pattern
Since all the candlestick patterns come with certain pros and cons, so makes the inverted hammer candlestick pattern. To arrive at a better understanding of the usage of this pattern, it is best to understand its advantages and limitations.
Positives:
- Convenient points of entry: Since the inverted hammer candlestick pattern has the potential of triggering the uptrend, the traders get an opportunity of entering the market at the start of a trend and capitalize when there is an upward movement.
- Ease in observing: The inverted hammer candlestick pattern can be easily identified when it is viewed on a chart.
Negatives:
- Extreme dependence on one candlestick: The inverted hammer candlestick pattern is an individual candle that represents price action. Depending entirely on this one fact, completely ignoring other indicators might result in underperformance or inappropriate action being taken.
- Limited time retracement: The inverted hammer candlestick pattern can point out a bullish price rise which might not lead to a long-term reversal in the trend. This case can occur when the buyers cannot deal with the buying pressure in the middle of a constant downward trend.
How To Employ the Inverted Hammer Candlestick Pattern While Trading
Employing the inverted hammer candlestick pattern does not end simply at the identification of this trend. Other important factors to consider and understand include the location of the hammer candle and the price action in sync with the ongoing trend.
How To Trade the Inverted Hammer Candlestick Pattern Close to a Line of Support
The basis of a bullish reversal is given by the appearance of the inverted hammer candle close to the support. The traders have the option of limiting their risk in case of market movement in the other direction by placing stops below the line of support.
When the targets are positioned at earlier resistance levels, it becomes possible to maintain a positive ratio of risk and reward. The main aim of the inverted hammer candlestick pattern is to point at a reversal in trend, which might also exist for a long time. Therefore, it is best for the traders to either use a trailing stop or observe multiple target levels.
Technical Analysis of the Inverted Hammer Candlestick Pattern: Fibonacci Retracement
Another advantage of the inverted hammer candlestick pattern is that it helps in identifying retracements in the market. The traders often have their eye on the chart to find complementary signals, which will help to ameliorate the possibility of beneficial trade. It helps by either supporting or standing against the idea of the trade before it is taken ahead.
There are many other candlestick patterns that you can study along with varied bullish reversal patterns, including Bullish morning star, double bottoms, and inverse heads and shoulders pattern. It would help if you also acquainted yourself very well with the candlestick charts before you start trading. Following all these measures, you would be ready to start trading using the inverted hammer candlestick pattern.

He is an expert in financial niche, long-term trading, and weekly technical levels.
The primary field of Igor's research is the application of machine learning in algorithmic trading.
Education: Computer Engineering and Ph.D. in machine learning.
Igor regularly publishes trading-related videos on the Fxigor Youtube channel.
To contact Igor write on:
igor@forex.in.rs
Related posts:
- What is Bullish Reversal?
- Evening Star Forex Pattern
- Piercing Pattern Candlestick
- Double Doji Candlestick Pattern!
- High Probability Reversal Candlestick Patterns – Case Study
- Candlestick Pattern Indicator MT4 Download – Candle Pattern Recognition
- Morning Star Forex Pattern
- How to Trade Pinbars? – Price Action strategy!
- Flag Pattern Trading – Bearish and Bullish Flag Chart Pattern
- Candlestick Reversal Patterns List
- Doji Candlestick Patterns
- What is a Pennant? – Bullish Pennant and Bearish Pennant Pattern
