Table of Contents
The MACD with two lines includes both the MACD line, which represents the difference between two EMAs, and a Signal line, which is the EMA of the MACD line itself; this dual-line approach provides a more precise visualization of momentum changes and trend reversals. With the two-line MACD, traders can more easily spot crossovers, where the MACD line crosses above or below the Signal line, serving as potential buy or sell triggers.
The traditional one-line MACD, which relies on a single line plotted against a zero line, can be less intuitive for identifying such trading signals and may delay the recognition of market shifts. Moreover, the two-line MACD’s inclusion of a Signal line smooths out fluctuations, offering a more refined and less noisy picture of market dynamics. Do not forget to read our article about the best MACD settings for 5-minute charts, 1-minute charts, and 15-minute charts.


This article will show MACD, which has two lines and offers a better visual representation. First, you can download it for free and enjoy our article.


Download MACD Indicator MT4 With Two Lines
Download MACD MT4 indicator with 2 lines
MACD Indicator MT4 With Two Lines- Understanding And How To Trade
As you know, the MACD indicator in MetaTrader has only a histogram and one line instead of two, as we can see in theory. This article will allow you to download the MACD indicator with two lines, and we will talk about this indicator.

What is the MACD two-line indicator?
The best MACD indicator for MT4 is one with two lines and one histogram. This indicator better represents the trend change and enables traders to understand the cycles of changing bullish and bearish trends. For example, indicator MACD two lines show that momentum increases if the two moving averages diverge, and momentum weakens if they converge.
After our MACD with two lines MT4 indicator, the best platform for market analysis (outside MT4) is TrendSpider (see platform) MACD with two lines indicator. See below in action:
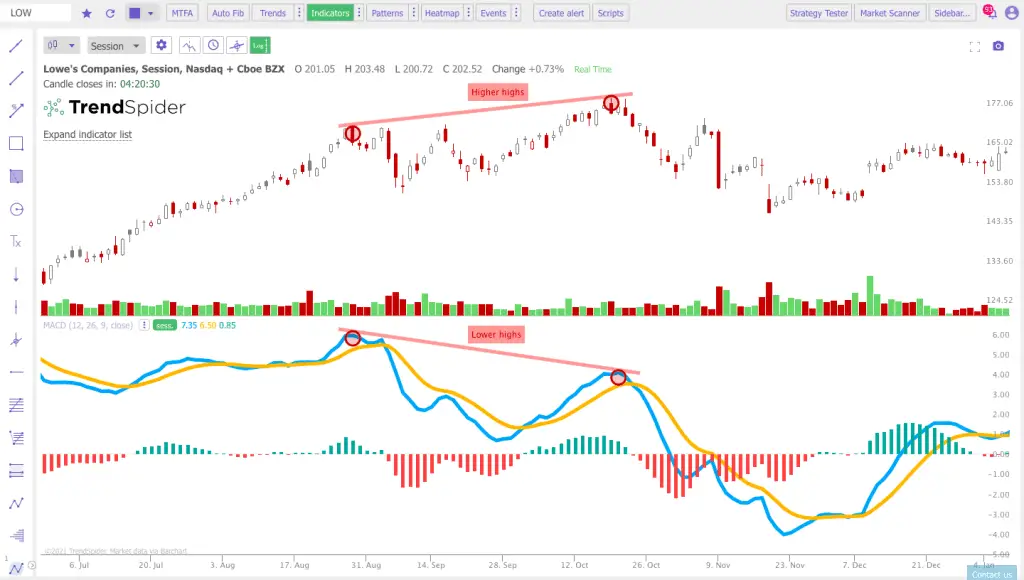
The chart presents the TrendSpider MACD tool.
What does the MACD two-line indicator draw?
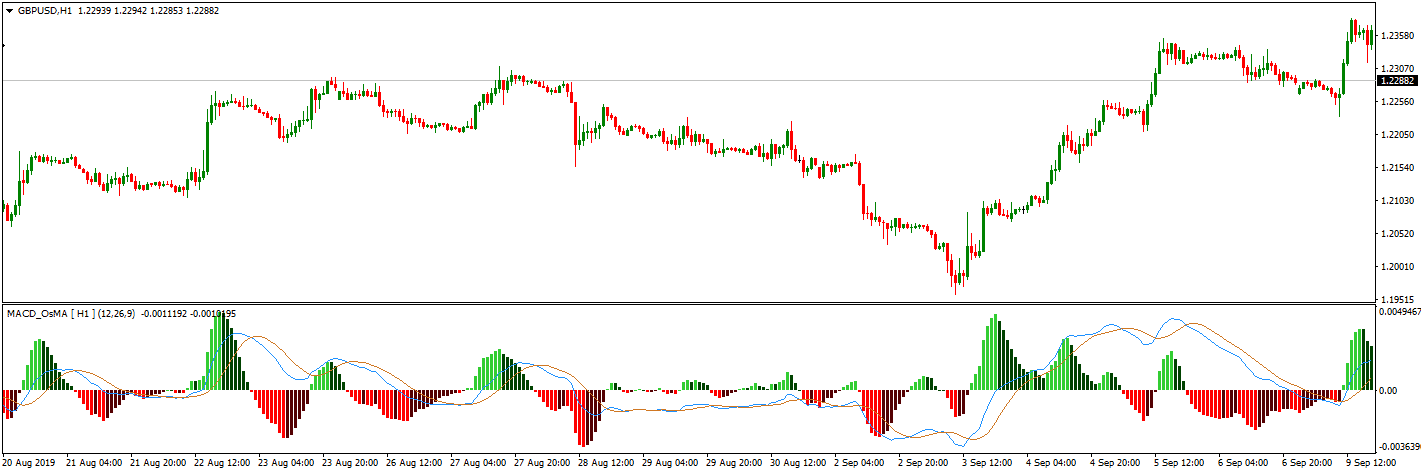
The MACD indicator MT4, with two lines, draws the Exponential Moving Average and volume histogram in a separate chart window. Traders can see histograms and two MACD lines used as crossover trading signals.
The world of trading has grown exponentially with the internet and online trading platforms. Nowadays, many indicators exist, yet MACD is still one of the most popular among experienced traders.
What Is The MACD Indicator?
MACD, or Moving Average Convergence Divergence, is an oscillator that measures price momentum. Traders usually use it as a signal for entry or exit positions. MACD can be used in a range, bearish, or bullish market. Gerald Appel developed this indicator during the 1970s.
To learn about the best MACD settings, visit our page.
When you first look at the MACD indicator, you realize that this indicator is an oscillator. Therefore, it can be applied to any trading asset, from forex to equities, to determine oversold and overbought zones.
The bars and lines in the MACD indicator are derived from its numerical settings. The “standard” MACD setting is 12,26,9. These numbers are derived from the old days when trading sessions were held six days a week. The standard MACD settings represented price movements of one and a half, two, and four weeks. These days, typical trading sessions are now five days a week. Hence, adjusting the “standard” setting can adapt to today’s trading environment. And yet, it’s also possible to use the “standard” settings as they’re most commonly used by traders, which is usually good in trading.
MACD with Two Lines Advantages
- Trend Identification:
- Crossing the MACD line (12 EMA minus 26 EMA) and the Signal line (9 EMA) can indicate trend reversals.
- When the MACD line crosses above the Signal line, it suggests a potential upward trend (bullish signal).
- Conversely, a cross below may signal a downward trend (bearish signal).
- Momentum Signals:
- The histogram visualizes the distance between the MACD and Signal lines, indicating momentum strength.
- A widening histogram suggests increasing momentum, while a narrowing one suggests decreasing momentum.
- Trading Signals:
- Traders can use MACD crosses to make informed buy or sell decisions.
- The indicator can help pinpoint optimal entry and exit points based on momentum shifts.
- Combination with Other Indicators:
- MACD can be paired with indicators like Bollinger Bands for more refined trading strategies.
- Using multiple indicators can confirm signals and reduce false positives.
- Short-term Trading Aid:
- The MACD is particularly useful for capturing short-term trends and swings in the market.
- It provides insights into the current strength of market moves, not just the direction.
- Divergence Detection:
- MACD divergences can signal a potential price direction change when the price diverges from the MACD lines.
- This can precede reversals, providing an early warning to traders.
- Exponential Moving Averages (EMA) Advantage:
- EMAs give more weight to recent price data than Simple Moving Averages (SMA), making the MACD more responsive to new information.
- This sensitivity makes the MACD a more timely indicator, crucial for fast-moving markets.
- Clarity on Fast and Slow Market Dynamics:
- The fast line (MACD line) reacts quickly to price changes, indicating short-term price movements.
- The slow (Signal) line provides a smoother, longer-term perspective on the trend.
One of the main advantages of using the MACD with two lines is that it can identify trends and signal market momentum shifts. When two lines cross each other, trend change can be easily identified. The histogram makes it easy to see when momentum is increasing or decreasing, which can then be used as a signal to take action, such as buying or selling assets.
Additionally, the MACD can be used with other indicators, such as Bollinger Bands, to maximize its effectiveness and create even more accurate predictions. Overall, the MACD is a powerful tool for analyzing trends and identifying trading opportunities in any market.
MACD is an excellent tool for traders looking to trade on short-term trends. The MACD line, calculated by subtracting 26 days from 12 periods and applying nine exponential moving averages onto its own Signal Line (which measures whether prices are rising or falling), can show you when there might be room in your portfolio for extra profits! This indicator doesn’t just tell us that something interesting happened with our investment–it provides insights into how strong these moves are in the present time.
MACD divergences are a valuable tool for traders because they can identify when the price of an asset may go into reverse. However, it’s important to remember that this indicator doesn’t predict how quickly or powerfully prices will move against one another. So, MACD with two lines is not a predicting tool; it is based on past data and does not use machine learning models to offer an estimated value.
First, focus on the two lines that typically oscillate within the confines of the indicator window. MACD is based on an exponential moving average instead of a simple moving average. Therefore, EMA represents MACD advantage over classic Simple Moving Average SMA because EMA has higher weighting on recent data than on older data.
The MACD builds upon this concept as it still incorporates a slow and fast line. The fast line is produced by subtracting the 26 EMA from the 12 EMA. For the slow line, it merely uses the value of the 9 EMA.
We can read more about the best MACD settings for intraday trading in our article.
Would you please download Macd indicator mt4 two lines: 2 line MACD indicator for MT4 free download?
Metaquotes create this indicator, and it is an essential trading indicator.
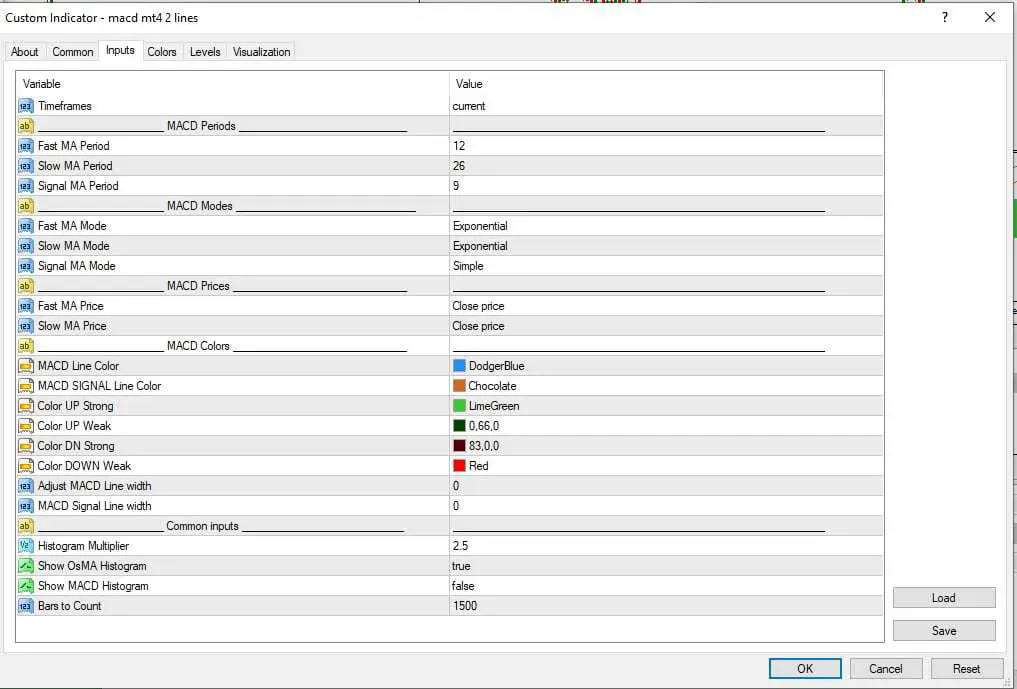
MACD indicator with two lines of Input
This version has nice colors. You can edit in Input:
Remember that the MACD is not a magic bullet at the end of the day. It is just a tool that will help you with your trading. This means that using this tool is up to you, and there is no right or wrong way of using this indicator. However, this article will show you the primary methods of trading the two MACD lines and other strategies.
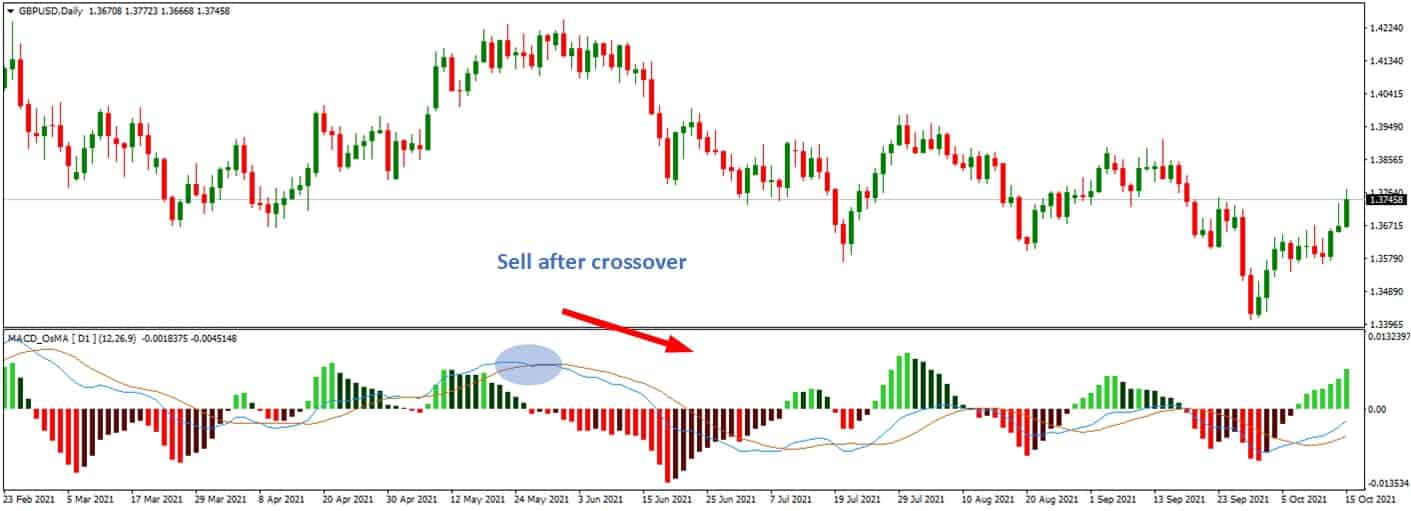
MACD crossover MT4 signal
MACD two lines indicator can be used to generate MACD crossover. You use the fast and slow line crossovers to signal entries and exits. For example, if you want to go long, you wait for the fast line to come from below, crossover to the top of the slow line, and enter a “buy” position. To exit, wait for the fast line to crossover towards the bottom.
This is perhaps the most basic way of trading the MACD, but here’s the thing.
Another valuable attribute of the MACD indicator is its ability to gauge the price’s momentum, which is why this indicator is standard among momentum traders. To better understand the price momentum, you’d want to refer to the MACD bars.
The longer the bar, the more momentum the price has. What’s neat about this is that you can compare the current bar’s momentum and refer it to the previous bar or bars for easily eyeballing momentum strength or weakness. For example, if the current bar is longer than the last bar and the previous bar is longer than the one that precedes it, you can say that the price is gaining momentum.
This indicates that this momentum trend will continue until it shows signs of weakness. If the opposite happens and the bar gets shorter and shorter, you can say the price momentum is weaker. However, the MACD indicator has another attribute that sets it apart from other indicators: divergence and convergence.
The easy way of understanding convergence and divergence is by referring to the price trend and the histogram. For example, the price swing high of the short-term trend is going higher and higher. However, if you look at the peaks of the histogram, they’re going lower and lower. This is what is called a divergence.
On the other hand, if the short-term trend’s price swing lows are going lower and lower, but the histogram’s troughs are going higher and higher, then this is described as convergence.
The appearance of divergence and convergence may signal that a possible trend change is coming. Thus, you may want to take positions counter to the current short-term trend. Entering a position before a price move is usually considered a “leading” strategy instead of a “lagging” strategy.
Conclusion
The MACD with two lines is an indicator that can trace its roots back to before computers and online trading became popular. It’s a valuable tool that has stood the test of time. Two lines on this indicator help traders better catch trend-changing moments.

He is an expert in financial niche, long-term trading, and weekly technical levels.
The primary field of Igor's research is the application of machine learning in algorithmic trading.
Education: Computer Engineering and Ph.D. in machine learning.
Igor regularly publishes trading-related videos on the Fxigor Youtube channel.
To contact Igor write on:
igor@forex.in.rs
Related posts:
- MT4 Forex Trend Line Indicator Download!
- Download MACD 4C Indicator
- Download MACD Divergence Indicator MT4!
- 3 Line Break Chart – Download 3 Line Break for MT4
- Download Forex Bar Timer Indicator – Candle Time Indicator MT4
- MBFX Timing Indicator – Free download MT4 Indicator
- Traders Dynamic Index Indicator – Download TDI Indicator
- How Does ADR Indicator Work? – Download ADR Indicator
- MACD vs. RSI – Which Indicator Gives Better Trading Results?
- Trend Dashboard Indicator MT4 Download – Forex Dashboard Free Download
- Trend Reversal Indicator Free Download! – Lucky Reversal Diamond Indicator
- Vertex Mod Indicator – Free Download Vertex Mod No Repaint Indicator
