Table of Contents
Imagine navigating a dense forest with no compass, map, signs, or clear pathways. That’s what it’s like trading in the often volatile financial markets without technical indicators. But what if there was a tool that could provide reliable markers to guide you through the trading wilderness? That’s where pivot points come into play.
Shrouded in the mystique of Wall Street and used by a legion of successful traders, pivot points are the unseen beacons that can illuminate the path of potential profitability in the financial market maze. Moreover, these not-so-secret coordinates provide traders with crucial information, helping them forecast where prices might face significant support or resistance – a veritable trader’s compass.


A pivot point is one of the many technical indicators used by traders. It tells us about the market’s overall trend over various time windows.


A typical pivot point strategy is based on the pivot point levels, analyzing previous day support and resistance. Traders must analyze movement through these levels to speculate the trend and direction.
Pivot Point Reversal Strategy
The pivot reversal strategy represents a major trend-following strategy where traders wait for short-term reversal and then create trades around the Pivot Point price level. For example, if the primary trend is bullish, traders wait for a pullback (short-time reversal) and make BUY orders around Pivot points.
Please watch my Pivot reversal strategy video with detailed instructions:

The pivot point reversal strategy offers several advantages for traders. It’s straightforward, easy to understand, and implement. The strategy is versatile and can be used in various markets, not just forex. Furthermore, it offers clear guidelines for entering and exiting trades, helping traders make objective decisions rather than relying on emotions. The calculated pivot points also serve as critical price levels, providing traders with crucial insights into market trends and potential reversals.
Pivot point reversal strategy steps are:
- Determine daily pivot point levels
- Determine the primary trend on Daily Chart
- Determine the last several days’ trend
- Pivot Point Reversal Strategy Trade execution
- Estimate stop loss and target based on Pivot Points, previous lows and highs, or ATR.
The pivot point focuses more on the closing price, associated with the bar that shows either the highest high or the lowest Low. This is how the indicator behaves in the following situations:
Pivot points price levels calculation.
Before delving into the reversal strategy, it’s crucial to understand what pivot points are. Pivot points are indicators used in technical analysis, originating from the floor trading era. They provide traders with a means of determining potential support and resistance levels before the market opens. These levels are derived from the previous trading session’s high, low, and closing prices.
The standard Pivot point levels formulas are:
- Pivot point price level (PP) = (High + Low + Close) / 3
- First resistance price level (R1) = (2 x PP) – Low
- First support price level (S1) = (2 x PP) – High
- Second resistance price level (R2) = PP + (High – Low)
- Second support price level (S2) = PP – (High – Low)
- Third resistance price level (R3) = High + 2(PP – Low)
- Third support price level (S3) = Low – 2(High – PP)
If you use MT4, you can download Pivot Point Indicator :
DOWNLOAD PIVOT POINT INDICATOR
Find the main trend
Usually, traders use the 200 moving average (SMA 200 or EMA 200) to determine the primary trend on the daily chart. In this case, when the price is above the EMA200 price, traders execute only BUY orders, and when the price is below EMA200 on the daily chart, traders execute only SELL orders.
The primary trend can be determined using trendlines on the chart or SMA50, SMA100, or SMA200 moving average. Traders can decide how they will choose the primary trend.
Please you can read our article What Are The Best Forex Trend Indicators
Pivot Point Reversal Strategy Trade execution in MT4
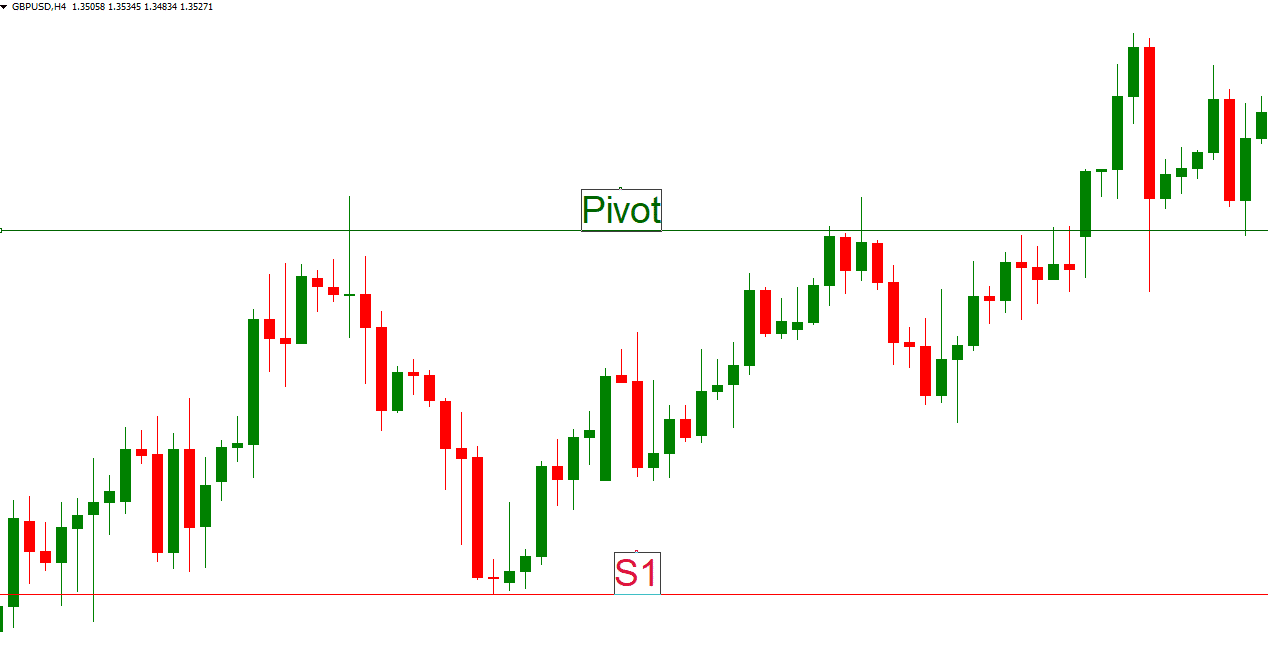
If the primary daily trend is bullish, traders wait for the price to touch the Pivot point or S1 level to enter into BUY trade.
If the primary daily trend is bearish, traders wait for the price to touch the Pivot point or R1 level to enter into SELL trade.
See an example of how to enter into BUY trade using Pivot Point Reversal Strategy Trade:
- For BUY trade, the S2 support level and the target are the R1 level.
- For the SELL trade, R2 is the support level, and the target is the S1 level.
- Stop loss and target price levels can be any previous low or high important price level.
In our article, you can Download Daily, Weekly, Monthly, High Low Indicators for the MT4, which can help you determine basic price levels for stop loss and target. Additionally, you can download the SSL channel for support and resistance determination.
Pivot Point Reversal Strategy Trade in TradingView
If you use TradingView for trading and strategy analysis, you can use an already-made indicator for the Pivot Reversal Strategy.
To use Pivot Point Reversal Strategy Trade in TradingView, add the following indicators on the chart:
- Then, choose from the strategy list “Pivot Reversal Strategy.”
- Add Moving average EMA200
- Add ATR bands or Pivot Stop loss Indicator to define Stop Loss or Target
Please watch my video from the Fxigor youtube channel about TradingView Pivot Reversal Strategy:
Conclusion
The pivot point reversal strategy is a valuable tool in a trader’s arsenal. By recognizing these critical points where price action might change direction, traders can make informed decisions and potentially increase their profits. However, like any strategy, the pivot point reversal is not foolproof.
It requires practice, skill, and the right combination with other technical analysis tools to increase its accuracy. Employing good risk management practices to protect your capital is also crucial. Finally, always remember that understanding and mastering a strategy takes time and consistent effort.

He is an expert in financial niche, long-term trading, and weekly technical levels.
The primary field of Igor's research is the application of machine learning in algorithmic trading.
Education: Computer Engineering and Ph.D. in machine learning.
Igor regularly publishes trading-related videos on the Fxigor Youtube channel.
To contact Igor write on:
igor@forex.in.rs
