Table of Contents
Traders, much like surgeons, require a level of precision that leaves little room for error. Just as surgeons must make exact incisions based on their deep knowledge of the human anatomy, traders need to pinpoint specific price levels in the market landscape. These price levels, be they support, resistance, or pivot points, act as the pulse of the trading world, indicating potential buy or sell zones. Misjudging or overlooking these levels can have significant ramifications akin to a surgeon’s misstep. Thus, mastering the art of identifying and respecting these levels is paramount for trading success.
What is Forex’s Perfect Entry price level?
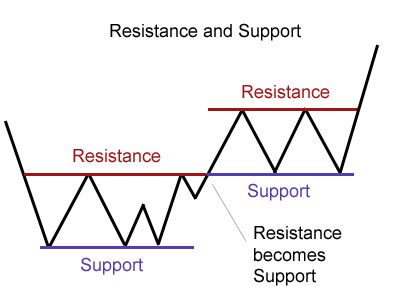
The Forex perfect entry price level is the previous high or previous low. Usually, previous support and resistance levels signify areas where the balance of buying and selling pressure has historically shifted, providing insight into potential future price behavior. As traders commonly set orders around these points, price reactions are often expected, making them strategic entry or exit positions.


- Forex Perfect Entry Point: The previous high or previous low.
- Represents historical points of strong buyer or seller interest.
- Acts as established benchmarks in a market’s price movement.
- Significance of Support and Resistance Levels:
- Indicate areas where buying and selling pressure has historically shifted.
- Offer insights into potential future price behavior.
- Used as key levels for setting strategic trades.
- Order Placement by Traders:
- Many traders set orders near previous highs or lows.
- Anticipation of price reactions at these levels is expected.
- This makes them ideal for strategic entry or exit positions.
- Hierarchy of Timeframes:
- Monthly price levels:
- Represent broader market sentiment.
- Typically, it is more significant due to the longer time frame.
- Weekly price levels:
- Less significant than monthly but more so than daily.
- Capture medium-term market movements.
- Daily price levels:
- Represent short-term market sentiment.
- It is less significant than monthly and weekly but still crucial for short-term traders.
- Monthly price levels:
How to Find an Entry Signal in Trading?
To find entry signals in forex trading, traders must define several fundamental and technical triggers. Usually, traders define previous support and resistance levels, significant price levels based on Fibonacci levels, Pivot points, or trading indicators (RSI, MACD, etc.).
After fundamental analysis, traders decide if the current trading period is suitable for buying or selling some asset based on major economic indicators such as GDP, Industrial production, NFP report, etc. An entry position can be made if several triggers show that time and price level are suitable for trading.
It is effortless to get overwhelmed by several tools offered on the trading platform to help you find an entry signal. Some traders do not rely on any indicator to identify an entry signal. There are many ways in which this can be done.
See example:

EURUSD entry Signal Example
1. Technical Analysis Criteria:
- Moving Average: The daily price of EUR/USD must be above its 200-day Exponential Moving Average (EMA200). This suggests the long-term trend is upward, and we want to trade in the direction of the trend.
- RSI (Relative Strength Index): The daily RSI must be above 50, which indicates momentum is bullish and not in oversold territory.
2. Fundamental Analysis Criteria:
- Interest Rate Differential: The European Central Bank (ECB) must have announced an interest rate increase or maintain a higher rate than the US Federal Reserve. This would typically drive strength into the EUR as higher interest rates often attract foreign capital inflows.
Trading Rules:
- Entry: Buy EUR/USD if all the above conditions are met.
- Stop Loss: Set a stop loss below the recent swing low, last week’s low.
- Take Profit: Target a risk-reward ratio that suits your strategy. For example, if your stop loss is 100 pips, aim for a 200 pips profit to maintain a 1:2 risk-reward ratio.
- Exit: Close the trade if the price crosses below the EMA200 or if the RSI drops below 50. Also, consider exiting if there’s a major change in the interest rate policy by the ECB or US Federal Reserve that goes against your trade.
Other considerations:
- Macro Economic Data: Be cautious of significant economic releases such as employment numbers, GDP figures, or other high-impact data. These can cause significant volatility and could temporarily override technical patterns.
- Risk Management: Never risk more than a certain percentage of your trading capital on a single trade. A commonly used threshold is 1-2% of your total capital.
- Review and Adjust: Always review your strategy periodically. The market environment changes, and what works today might not work tomorrow.
Entry signal example for GBPUSD
Technical Analysis Observations:
- Seven Days High Break: Today’s GBP/USD price has breached the highest level of the past seven days. This suggests bullish momentum and can be a sign of further upward movement.
- EMA 200 Break: GBP/USD price today has crossed above its 200-day Exponential Moving Average (EMA200). A breakout above this long-term moving average indicates a strong bullish trend.
- Trendline Confirmation: The prevailing trendline, drawn from recent lows, shows an upward trajectory. This adds to the bullish technical picture.
Fundamental Analysis Observations:
- Optimistic GDP Projection: Recent GDP reports for the UK project a healthy growth trajectory, suggesting underlying strength in the UK economy, which can support a stronger GBP.
- Rising Industrial Production: The latest data indicates that the UK’s industrial production outperforms the previous month’s results. This can be a bullish sign for the currency as increased industrial activity suggests a healthy economic environment.
- Weak US NFP Report: The US Non-Farm Payroll (NFP) report has come in below expectations. This can weaken the USD as the NFP is a significant indicator of the US economic health.
Entry Signal:
Given the combination of bullish technical triggers and positive UK economic indicators, coupled with a weak US economic data point, the strategy suggests a BUY signal for GBP/USD.
Trade Setup:
- Entry Point: Consider entering the trade at the current market price or a slight pullback.
- Stop Loss: Set a stop loss below the recent swing low or below the EMA 200 to protect against potential reversals.
- Take Profit: Target a suitable risk-reward ratio based on your strategy or set profit targets at crucial resistance or psychological levels (like 1.4000, 1.4100, etc.).
Conclusion
Price levels, like previous support and resistance, serve as critical guideposts for traders in the financial markets. These levels indicate historical points where a forex asset has reversed and provide insights into future potential movements. Recognizing and understanding these zones can offer traders optimal entry and exit signals, enhancing the potential for successful trades. Mastering support and resistance is fundamental for anyone navigating the market landscape effectively.

He is an expert in financial niche, long-term trading, and weekly technical levels.
The primary field of Igor's research is the application of machine learning in algorithmic trading.
Education: Computer Engineering and Ph.D. in machine learning.
Igor regularly publishes trading-related videos on the Fxigor Youtube channel.
To contact Igor write on:
igor@forex.in.rs
