Table of Contents
The 200 EMA (Exponential Moving Average) trading strategy is a trend-following strategy used in technical analysis. The strategy is based on the principle that the 200 EMA line on a price chart is a significant level of support or resistance, and the price tends to bounce off when it reaches that level.
The 200 EMA is a widely used technical indicator that tracks an asset’s average price over 200-time intervals. The EMA gives more weight to recent price data, making it more responsive to recent price changes than a simple moving average.


In the 200 EMA trading strategy, traders look for long-term trends in the market by analyzing the 200 EMA line on a price chart. When the price is above the 200 EMA, traders consider the need to be in an uptrend, and when the price is below the 200 EMA, they think the market to be in a downtrend.


Traders use the 200 EMA line to identify potential entry and exit points. For example, traders may consider buying the asset if the price is an uptrend and bounces off the 200 EMA line. Conversely, traders may consider selling the purchase if the price is downtrend and falls below the 200 EMA line.
What is an EMA trading strategy?
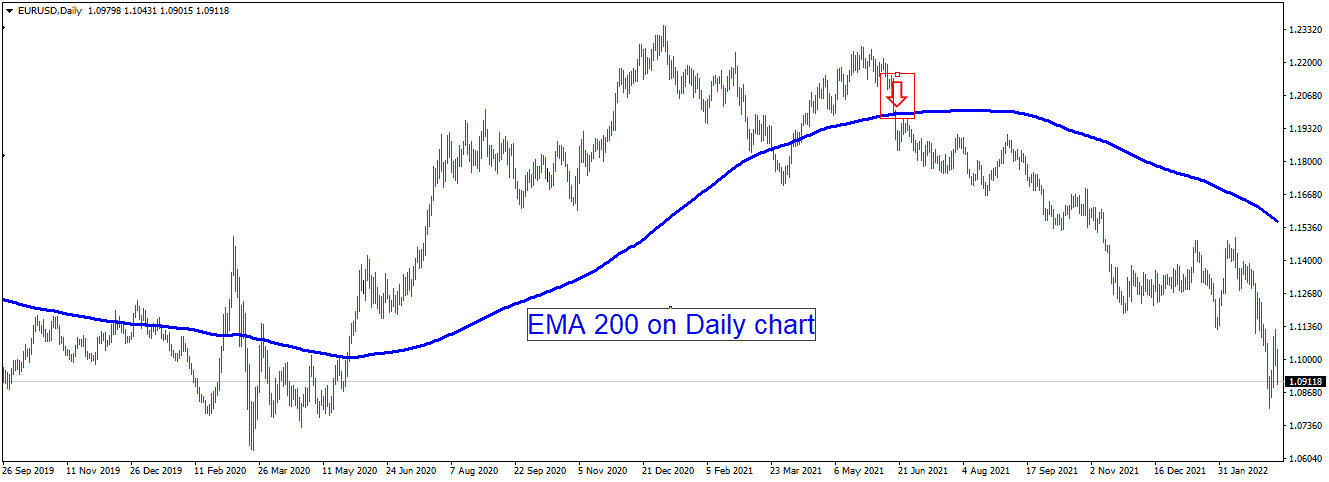
EMA trading strategy represents the exponential moving average strategy where the main goal is to define the primary trend in the market. For example, traders can use the EMA indicator to determine the market’s predominant direction, the BUY trade’s support level, and the SELL trade’s resistance level. The most used exponential moving average is EMA200 on the daily chart time frame.
An EMA (Exponential Moving Average) trading strategy is famous approach traders use in technical analysis. The strategy involves using the EMA indicator to identify potential trade setups and make trading decisions.

The EMA is a moving average that gives more weight to recent price data, making it more responsive to recent price changes than a simple moving average. Traders use the EMA to track the average price of an asset over a specified period.
In an EMA trading strategy, traders typically use two or more EMA lines with different periods. The shorter EMA line reacts more quickly to price changes, while the longer EMA line reacts slower. Therefore, traders look for the crossover of the shorter EMA line above or below the longer EMA line to identify potential entry and exit points.
For example, if the shorter EMA line crosses above, the longer EMA line, traders may consider it a bullish signal and look to buy the asset. Conversely, if the shorter EMA line crosses below, the longer EMA line, traders may consider it a bearish signal and look to sell the asset.
Traders may also use the EMA lines to identify the trend direction and potential support and resistance levels. For example, if the price is above both the short and long EMA lines, traders may consider it an uptrend and look for buying opportunities. Conversely, if the price is below the short and long EMA lines, traders may consider it a downtrend and look for selling opportunities.
So, what does the 200ema represent:
What is the 200 EMA indicator?
200 EMA on a daily chart represents the exponentially weighted moving average for the last 200 days (periods). This averaging price method acts more significantly to recent price changes than a simple moving average (equal weight moving average). Therefore, the 200 EMA indicator on the daily chart announces long-term trends, and usually, when a stock (asset) price crosses 200 MA or 200 EMA, it is assumed that the trend has changed.
Foreign exchange (Forex) traders use the 200 exponential moving average (EMA) and the stochastic indicator for their scalping strategy. If the price is below 200 ema, the forex trend is down; if it is above 200 ema, it is considered an upward trend. The stochastic indicator is used to determine oversold or overbought market conditions. For this indicator, when the stochastic levels exceed 80, too many traders have invested, and prices are likely to decrease. On the other hand, if the stochastic indicator drops below 20, the forex market is oversold, and prices will likely increase in the future.
Using 200 EMA and stochastic indicators for forex trading – Stochastic pullback strategy
200 EMA and stochastic indicator trading strategy is a trend trading strategy where orders are generated after a pullback. While the 200 EMA moving average represents an indicator that shows the following, the stochastic indicator determines the moment to enter into a trade. BUY order will be generated if the main trend is uptrend above the 200 EMA value while the stochastic indicator is below 20. A SELL order will be generated if the main trend is a downtrend moving below the 200 EMA value while the stochastic indicator is above 80.
Trading parameters
This scalping strategy can be used for any currency pair. The time frames can vary and should preferably be more than 5 minutes. The 200 ema and stochastic are the leading Forex indicators used. The MT4 forex trading platform users will find that the stochastic indicators are the default setting.
Prepare:
1. EMA 200 indicator on the chart
2. Stochastic indicator (oscillators)
3. Download the Fibo expansion Indicator Mt4
200 EMA Stochastic Strategy BUY rules
BUY if the price is above 200EMA, AND the stochastic indicator is below 20.
The trend is bullish.
Stop loss and target are defined as buying Fib—levels using the auto Fib indicator.
The trader should only buy the Forex prices in an uptrend above the 200 ema. Simultaneously, the stochastic indicator should have declined below twenty and is now increasing in value. If these conditions are met, the trader can place a buy order when the candlestick closes.
200 EMA Stochastic Strategy Sell rules
SELL if the price is below 200EMA, AND the stochastic indicator is above 80.
The trend is bearish.
Stop loss and target are defined as buying Fib—levels using the auto Fib indicator.
After noticing a downtrend in the market, the trader should sell with prices below the 200 ema indicator level. He should also confirm that the stochastic indicator value checks whether it has exceeded 80 and is now reducing. If both these conditions are satisfied, the trader should immediately place his order for selling when the candlestick closes.
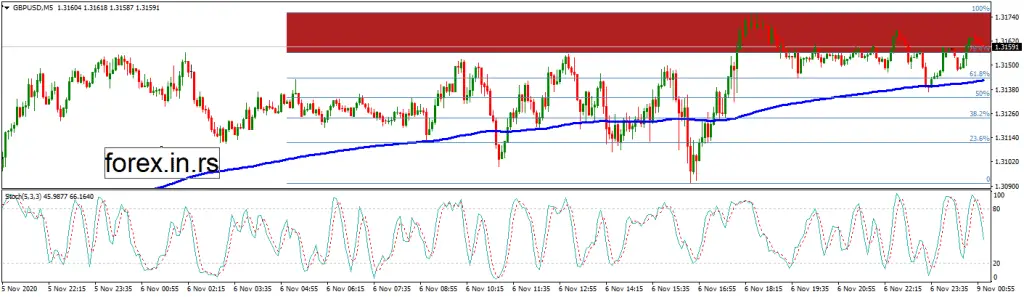
BUY trade example:
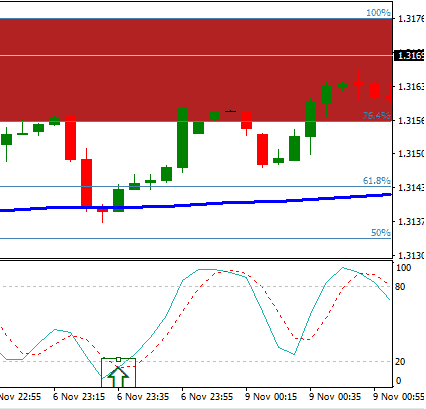
On 5 minute chart, the price is above EMA200, and the stochastic is below 20. Stop loss is 50 Fib. Level and targets are 76.4% and 100% Fib. Levels.
Disadvantages of the stochastic, 200 ema indicator, scalping strategy
This strategy is ineffective when no trends exist; the market moves sideways since many false signals are generated. The stochastic indicator oscillates between extreme values. Traders will find that they face the problem that the trend is powerful, yet the stochastic indicator gives a false signal.
Advantages of 200 EMA indicator
The 200 Ema indicator helps detect the trend, and the stochastic indicator helps measure how strong the trend is. Since two indicators are used, purchasing or selling Forex is safer. For additional checking before placing forex trading orders, candlesticks for forex reversal can be used to confirm the right point to enter a forex trade.

He is an expert in financial niche, long-term trading, and weekly technical levels.
The primary field of Igor's research is the application of machine learning in algorithmic trading.
Education: Computer Engineering and Ph.D. in machine learning.
Igor regularly publishes trading-related videos on the Fxigor Youtube channel.
To contact Igor write on:
igor@forex.in.rs
Related posts:
- How Does Stochastic RSI Work? – Stochastic RSI Calculation
- Forex Weekly Strategy Based on 200 Moving Average
- How to Use Stochastic Oscillator? – Stochastic Oscillator in Technical Analysis
- Stochastic Oscillator vs. Relative Strength Index (RSI)
- Keltner Channel Strategy
- The Best Divergence Trading Strategy
- Hull Moving Average Best Settings! – Hull Moving Average Strategy Example!
- Pivot Point Reversal Strategy
- MACD and Bollinger Bands Strategy – BB MACD Tutorial
- Awesome Oscillator and MACD Strategy! – Awesome Oscillator vs. MACD
- Balance of Power Indicator and Strategy – BOP Indicator
- Volume Weighted Average Price VWAP Strategy – VWAP indicator for Nifty
