Table of Contents
Pivot points help know the support and resistance while trading equity, commodity, and other financial assets. Pivot points are easy to calculate as they can be derived using the open, close, low, and high points of the past day or week. As a trader knowing pivot points and their related strategies can prove beneficial to profit; let’s dive into it.
Pivot Point Bounce Strategy
The pivot point bounce strategy represents a trading strategy based on Pivot Point Zone in short term time frames using daily pivot points. In this strategy, buy trades are created when an hourly close candle is above Pivot Point Zone and sell trades when the hourly close candle is below Pivot Point Zone. The system goes forward and trades the price that is moving ahead and then changes it by bouncing off to any other pivot points.


It works based on reversal as when a particular price reaches a pivot point, too for the initial time in each direction; it reverses the trend.


Learn the Default Trade Option
In this trading option, bar charts of 1 to 5 minutes are used; their open, high, low, and close (OHLC) prices are used along with the daily pivot points. In the preference of traders, it is whether they would like to automate it or place the trade manually.
The default trade strategy can be used for any time zone, i.e., your local time zone or the market time zone you are trading. The most active and hectic hours are considered the most profitable hours for pivot point bounce strategy. These hectic hours are generally within the initial one or two hours when the market is about to open or close.
Pivot Point Zone
The pivot point zone is are in the chart above and below the pivot point level.
Formula is:
Pivot level = (High + Low + Close) / 3

Pivot2 level = (High + Low) / 2
Difference = |Pivot – Pivot2|
Pivot High price level = Pivot + Difference
Pivot Low price level = Pivot – Difference
Pivot High to Pivot Low is the Pivot Zone area.
How to Trade Pivot Point Bounce?
The following is the step-by-step guide on how forex traders can implement their pivot point bounce strategy.
Step 1 – Choose a market, add daily pivot points, and open the related OHLC (Open, High, Low, and Close) bar chart.
Step 2 – Look when the price of your stock or any asset reaches Pivot Point Zone.
Step 3 – Wait till the hourly candle closes below or above Pivot Point Zone.
Step 4 – Enter your trading position.
Step 5 – Follow the main daily trend if you trade on the hourly chart.
If it’s a long trading position, the price bars should ideally make new lows when they reach a pivot point, whereas, for a short trading position, the price bars should ideally make new highs when they are reaching a pivot point. The following explanation would clear your doubts.
For Long (Buy) Trading Position
- On the daily chart, the main trend is bullish.
- On the hourly chart, the hourly candle close is above the Pivot Point Zone.
- Close trade if the hourly close is below Pivot Zone or if it reaches some Resistance level.
For Short (Sell) Trading Position
- On the daily chart, the main trend is bearish.
- On the hourly chart, the hourly candle close is below the Pivot Point Zone.
- Close trade if the hourly close is above Pivot Zone or if it reaches some Support level.
A stop-loss can be put at the pivot point or the entry bar’s high/low in this trading strategy. Though it depends on the market you are trading in. There are no particular types of orders that a trader has to use for this trading strategy, though a limit order is preferred as it saves traders from the downside risk.
Pivot Point Bounce Trading Strategy Example
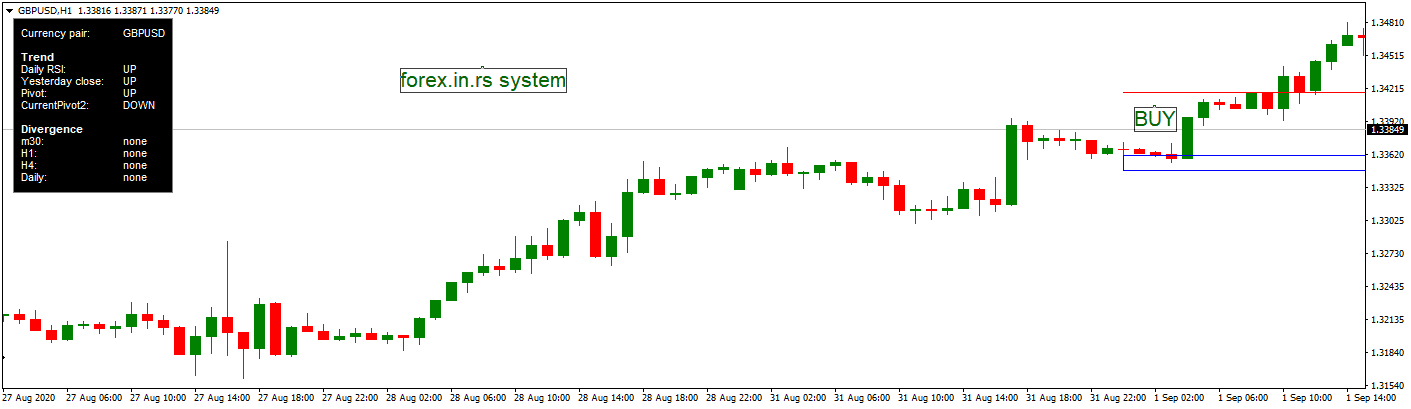
It is September 1. 2020. For GBPUSD trend is bullish.
Pivot level = (High + Low + Close) / 3= 1.335
Pivot2 level = (High + Low) / 2= 1.3362
Difference = |Pivot – Pivot2|= 1.3362-1.3350=0.0012 (12 pips)
Pivot High price level = Pivot + Difference= 1.3350+12 pips= 1.3362
Pivot Low price level = Pivot – Difference= 1.3350-12= 1.3338
Pivot Zone is between 1.3338 and 1.3362
In the morning, Pivot Zone is broken, and the BUY trade is created because the bullish candle is above Pivot Zone.
Trade will be close if the hourly close is below 1.3338 or the price touch resistance level 1.348.
When to Exit the Trade?
Once you meet your desired trading price or hit the stop loss, the trade gets automatically filled. In general pivot point, bounce trading strategy takes a few minutes to get executed but can extend to several hours.
As per the market you are trading in, you can adjust the target to the next pivot point or change the stop loss to make it suitable for your trading limits.
The best results this strategy has in the period on London market open or US market open.
It is recommended that you try this type of trading strategy on a practice online account to avoid taking unnecessary risks. Once you have enough experience, you can move forward to real forex trading. Though being cautious as the forex market is very dynamic and fluctuating, you can easily drown if you get caught off-guard.

He is an expert in financial niche, long-term trading, and weekly technical levels.
The primary field of Igor's research is the application of machine learning in algorithmic trading.
Education: Computer Engineering and Ph.D. in machine learning.
Igor regularly publishes trading-related videos on the Fxigor Youtube channel.
To contact Igor write on:
igor@forex.in.rs
