Table of Contents
Do you know what Pivot is? Usually, a pivot is a pin on which something turns, a key player, or position – the important person in some situation upon and about which something rotates or oscillates. In sports, the pivot is an important handball player who oscillates in the attack zone. In trading, the pivot is an important price level.
For day trading, traders try and mix different trading strategies and patterns. Traders popularly use various technical analysis tools, and one such technical analysis tool is the pivot point. Pivot point trading is prevalent in the equity and commodity markets, and it is part of the major tools in technical analysis.


What are Pivot Point levels?
The pivot point levels are price levels on the trading chart calculated based on the previous trading sessions’ high, low, and closing rates. They help decide the support and the resistance level for the current and next trading sessions. Pivot point price levels can be used as support and resistance price levels and help traders decide when to enter the market and exit.


Day trading using last-day pivot points also provides insights into the market trend over a period of time. As the pivot points are calculated on the average of previous trading sessions’ data, it represents moderate accurate and updated predictions for the market. Usually, If the trading is done above the data shown in the pivot points, it states the bullish stance, while trading at the below level states a bearish stance.
Now let us see what Pivot Point Trading is.
What is Pivot Point Trading?
Pivot point trading is a trading strategy where traders use Pivot point levels for entry positions and exit positions as important trading levels. Day traders use daily and intraday pivot point levels, weekly traders weekly pivot point levels, etc. Using this kind of strategy, traders trade assets respecting current volatility.
Calculating Standard Pivot Point Levels
Like other technical analysis tools, there are various ways in which a trader can calculate the pivot point, though the crown for the most popular method goes to the Five-point system. In this method, high, low, closing price and two supports, as well as two resistance levels, are considered, making it a five-point calculation. The following is the equation for the same.

The standard Pivot point levels formula is:
Pivot point price level (PP) = (High + Low + Close) / 3
First resistance price level (R1) = (2 x PP) – Low
First support price level (S1) = (2 x PP) – High
Second resistance price level (R2) = PP + (High – Low)
Second support price level (S2) = PP – (High – Low)
Third resistance price level (R3) = High + 2(PP – Low)
Third support price level (S3) = Low – 2(High – PP)
Identifying Support and Resistance Levels with a Pivot Point Indicator
Please, download the Pivot Point indicator.
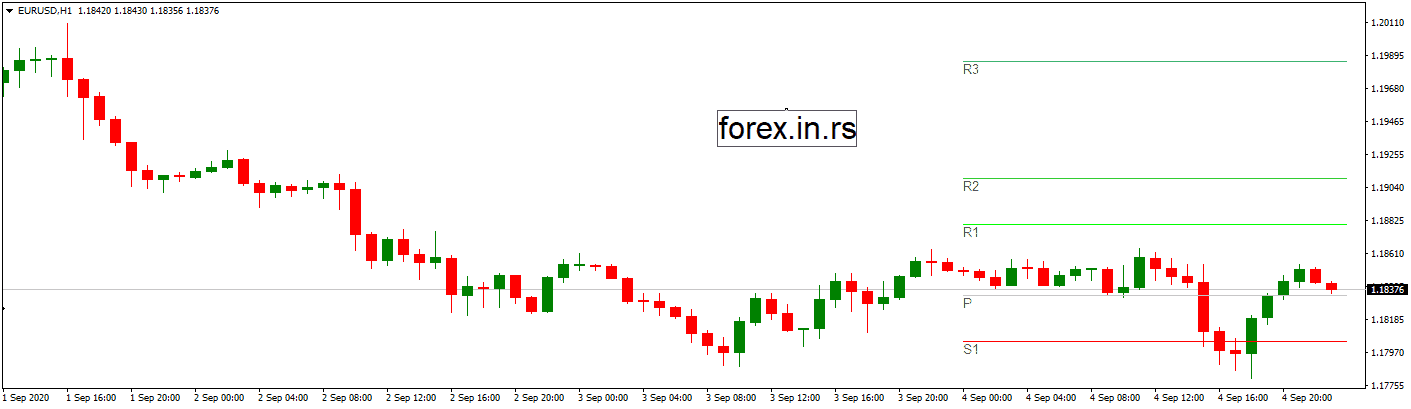
The pivot point level will be calculated based on your Metatrader time.
For forex markets running 24 hours, the pivot point can be calculated using the closing time (4 pm EST) of the New York market. In most common trading practices, the GMT format is used; thus, you can also use 00:00 GMT as the opening and 23:59 GMT to close for your new trading session. If the stock you are trading in is active only during certain daily hours, you can use the data of high, low, and closing rates from those common or standard trading sessions of the day.
Pivot points are typically used, implying the last trading day’s data, though you can also use last week’s data to predict the coming week. You can determine the support and resistance level for the next week as well. That technique is useful for swing traders or traders who trade currencies for longer-term compared to day trading.
Using Opening Price to Calculate Pivot Point
This is an alternative method to calculate the pivot point using the five-point system, including the opening price.
Pivot Point = Current (Today’s) Opening + Yesterday’s High Price + Yesterday’s Low Price + Yesterday’s Closing Price / 4
The only difference here is the inclusion of opening price; support and resistance levels can be determined in the same manner described in the above table.
The realm of calculating pivot points using various data sets and trying new techniques is vast. Knowing how to calculate pivot points is essential to know about what you are implementing. You can also add these indicators to your trading chart and decide your trading strategy.
Types of Pivot Points
Except for standard pivot points, there are some variations in formulas.
For example, DeMark Pivot Points are calculated based on X, such as:
If Close < Open then X = (H + (L * 2) + C)
If Close > Open then X = ((H * 2) + L + C)
If Close = Open then X = (H + L + (C * 2))
R1 = X / 2 – L
PP = X / 4
S1 = X / 2 – H
PP is the Pivot Point, R1 is the upper Resistance level, S1 is the lower support level.
Demarks’ pivot points strategy is based on trendlines and DeMarks pivot levels. Traders need to draw trendlines on the chart and then to enter into a trade at the moment when price pullback, touch trendline, and DeMarks level. DeMarks pivot levels are used for entry and exit from the trade.
Fibonacci Pivot point levels are calculated based on Fibonacci levels, the difference between the high and low, and the standard pivot point price level.
P= Previous High Price + Previous Low Price + Previous Closing Price
D – the difference between the high and low.
S1 = P – 0.382D
S2 = P – 0.618D
S3 = P – D
R1 = P + 0.382D
R2 = P +0.618D
R3 = P + D
Pivot Point Calculator
Please, use the current Pivot Points calculator to calculate current market Pivot Points:
How to Interpret and Use Pivot Points in Trading?
In simple words, pivot points indicate the support and resistance level; these levels are the turn-up of a substantial price event. The reason is that the price is not likely to fall below the support level or go beyond the resistance level. Thus, the trading trend would reverse at these points.
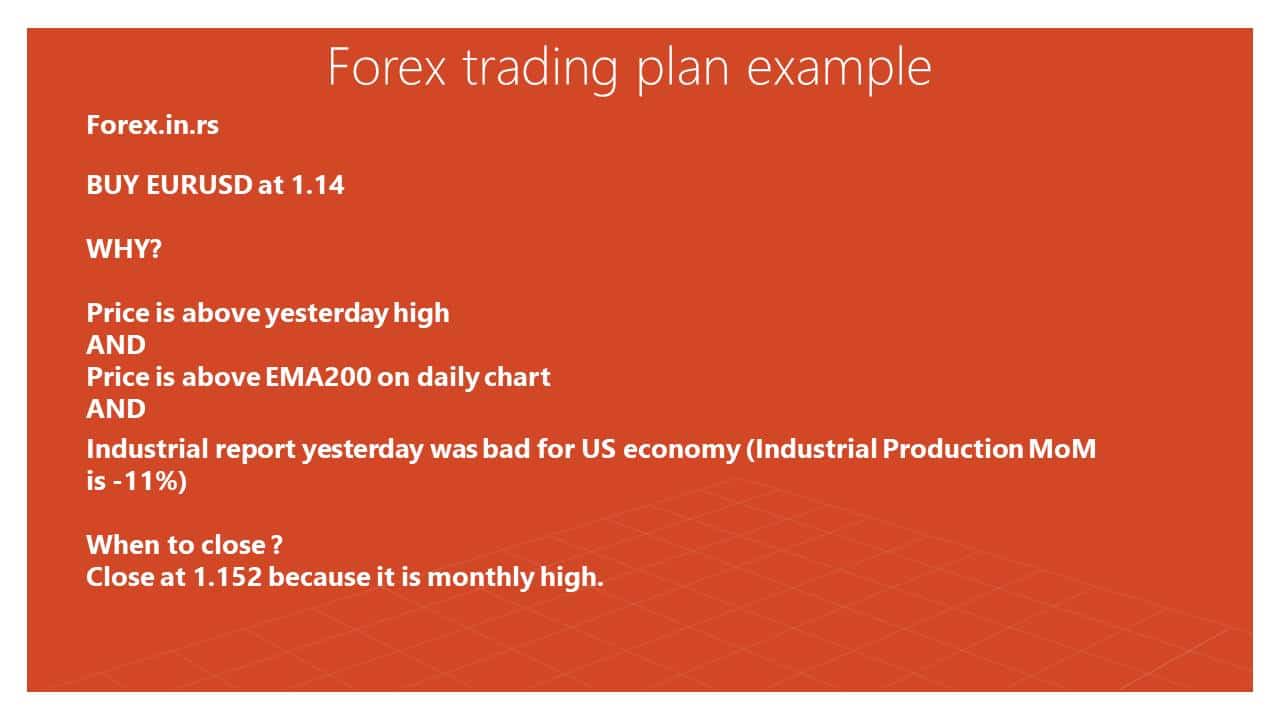
There are two methods to use pivot points. The first use is to predict the market’s overall trend, and the second use is to decide when to enter and exit the market.
If there is an upside movement on the pivot point in the first usage, the market trend would be bullish and vice versa. In the second usage, traders can place orders when the stock price breaks the support or resistance level.
As a trader, you must be cautious in choosing the technical indicators as they are not accurate every time. The price can fall after breaking the resistance point instead of hiking, leading to a loss. Thus, it would help if you incorporated various tools in addition to pivot points.
Trading is an art, and any technical pattern or tool’s success depends on how the trader can use it effectively. You can use other indicators like candlesticks patterns, moving averages, Bollinger Bands, MACD, etc., to predict the market and stock trends. The more assertive indicators, the more chances for them to be correct.
Weekly Pivot Points Strategy
The weekly pivot point strategy usually for entry points determines Pivot point or R1 for BUY entry-level or Pivot point or S1 for sell entry-level. For stop-loss, the best approach is to choose the lowest/highest level for the last 2-4 weeks. The target can be set using any Pivot point next level.
In the weekly pivot point strategy, it is important to move price for stop loss level or target level after few weeks if we have volatile markets. It is important to use fundamental news as triggers as well because long-term trades are connected with the economic situation as well.
Conclusion
As stated, pivot point trading is helpful, but it is more effective when mixed with other technical analysis tools. The calculation is simple, but the usage varies from trader to trader. The more you practice it, the better you would be able to take advantage of it.
Though, remember that the currency market is highly fluctuating and gets affected by events around the globe. Thus, knowing just one technique or tool would not help you. You need to educate yourself and stay updated with the latest tools and research in this field. In the end, it is all about your hard work, perseverance, and your abilities.

He is an expert in financial niche, long-term trading, and weekly technical levels.
The primary field of Igor's research is the application of machine learning in algorithmic trading.
Education: Computer Engineering and Ph.D. in machine learning.
Igor regularly publishes trading-related videos on the Fxigor Youtube channel.
To contact Igor write on:
igor@forex.in.rs
Related posts:
- Pivot Point Bounce Trading Strategy
- Pivot Point Reversal Strategy
- Download Pivot Point Indicator MT4
- How to Use Woodie’s Pivot Points?
- How to Set Profit Target in Trading?
- Download Auto Support Resistance Indicator
- Forex Perfect Entry – How to Find Entry Signal in Trading?
- Fibonacci Retracement Trading Strategy! – Golden Ratio Strategy!
- Download Daily Weekly Monthly High Low Indicator for the MT4
- Forex Day Trading Best Indicators – Case Study
- What is Naked Chart Trading?
- Forex No Indicator Trading – How to Trade Forex Without Indicators?
