Table of Contents
Forex indicators are tools traders use to help analyze the market and make more informed trading decisions. Many indicators can be used in forex, including technical indicators like moving averages, volume-based indicators like the accumulation/distribution line, and momentum indicators like the relative strength index (RSI).
Each indicator serves a specific purpose and can provide valuable insight into how currency prices move. For example, technical indicators can help you identify trends in the market or spot potential entry and exit points for your trades. Meanwhile, volume-based indicators can measure buying or selling pressure changes in a given market. In contrast, momentum indicators can help spot periods of increased volatility.


Forex traders should choose the indicators that work best for their trading strategies and styles. By doing so, they will be better able to identify opportunities in the market and manage risk effectively.


Which Forex Indicator is the Most Profitable?
There is no clear proof that some indicators can be profitable. Usually, technical indicators do not predict future prices, only analyze past performance. The best indicator for me is the Relative Strength Index (RSI) because it measures trend strength and, simultaneously, the change in price momentum.
Indicators can help traders determine the right time and price levels to enter or exit the trade. A lot of scientific research papers tried to find an answer to this. All researchers tried to find good forex trading indicators and create a ranking list looking for the best and most profitable forex indicator strategies.
For example, Exchange rate prediction using hybrid neural networks and trading indicators, Fuzzy logic, trading uncertainty, and technical trading.
Many researchers tried to find answers to testing RSI and MACD indicators, such as the article Revisiting the Performance of MACD and RSI Oscillators or Technical analysis and the London stock exchange: trying the MACD and RSI rules using the FT30.
But there is no consensus about Which Forex Indicator is the Most Profitable !!!

Forex markets are full of uncertainties and risks. If the stakes are not anticipated or calculated properly, traders fail miserably. As per an estimate, 96% of the traders lose a lot of money in the market and subsequently lose. So why is it that forex trading proves to be a failure more often than not? It’s because of the following reasons:
- No or little knowledge about the market and the trading strategies
- Poor risk management and overtrading.
Someone new to forex trade obviously would not know much about the market and trading strategies. He would not learn when to trade and when not to trade. Due to little knowledge, they end up trading on holidays, which is the worst time to trade. That’s because the volatility and liquidity of the market are the lowest at this time. Traders in the forex market need to closely monitor these indicators and act when there are maximum profit opportunities.
Forex indicators only give traders a better edge, remove noise from the price chart, and provide a clearer picture to the trader. Indicators are the only tools for better visualization of the market price action.
Research about the most profitable indicator – Case Study
Recently, we made a poll and one research case study about the day trading best indicator.
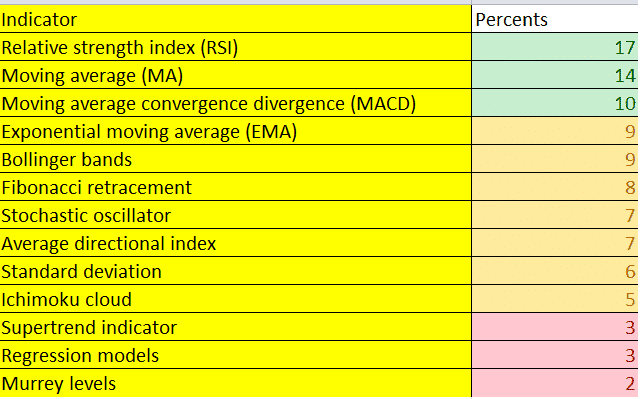
Traders have no clear consensus regarding which indicator is the best for intraday trading. According to a recent survey, the most famous indicator is the RSI, with 17% of votes. Other commonly used indicators include MACD, moving averages, and Bollinger bands, though none received more than 10% of the vote.
While there is no conclusive evidence that any indicator is better than the others in predicting market movements and identifying good trading opportunities, many traders still rely heavily on these tools when making their trading decisions. To be successful in day trading, it is essential to carefully analyze market trends and price action using various indicators to develop a well-rounded understanding of market conditions and potential opportunities. Ultimately, the best indicator for day trading will depend on each trader’s preferences and strategies.
The most used indicators in forex trading
So which forex indicator is most profitable? To determine the same, some technical indicators depend on their use.
Forex indicators come in extremely handy in predicting fluctuating prices. Using the perfect indicator is the key to accurate estimations and profits. A new forex trader should be continually learning about the market. To succeed in forex trading, one must understand the aspects of technical analysis and the respective technical indicators that are a significant part of the analysis. There are two types of market analysis in forex, which are: Fundamental and Technical.
While fundamental analysis is more based on the overall market trends and physical indicators and their functioning over time, technical analysis is about the technical indicators. To forecast price changes, effective technical indicators, and research come very handily. You must select a perfect technical indicator to earn maximum profits.
Let’s look at some of the most profitable indicators that help estimate price movements.
While there are too many indicators for technical analysis, the best ones are few. Listed below are some of the most profitable indicators used by traders:
Candlesticks recognition indicators
Candlestick pattern indicators are a powerful tool used by traders in analyzing price movements and predicting future price trends. These patterns can give important insights into an asset’s underlying supply and demand dynamics, helping traders identify potential entry points and exit strategies.
Many candlestick patterns, including the doji, hammers, and shooting stars, can be used as indicators. Each pattern conveys different information about market sentiment and can help traders better understand how market participants react to price changes.
For example, a bullish hammer is a strong indicator of an upcoming upward move in the price of an asset, while a bearish doji signals that the trend may be reversing or heading for a pullback. By carefully observing these and other patterns, traders can improve their ability to anticipate price movements and effectively manage risk when entering or exiting trades.
Pros
- Significant in terms of reversal zones confirmations
- Provision for multiple entries post any reversal
- It takes you to make a profit faster and avoids losses once you profit.
- It Cuts downtime on all the charts to a great extent.
Cons
- It would help if you used additional confirmations like Harmonic Patterns, Fib Retracements, Trendlines, Pitchforks, etc. It is not a strategy that works on a ready-to-serve basis; many demos are required to learn the don’ts.
- Need to combine with fundamental analysis all the time.
Moving Average
These are the best indicators that help identify the trend and necessary following. It reflects the average values of the process over time.
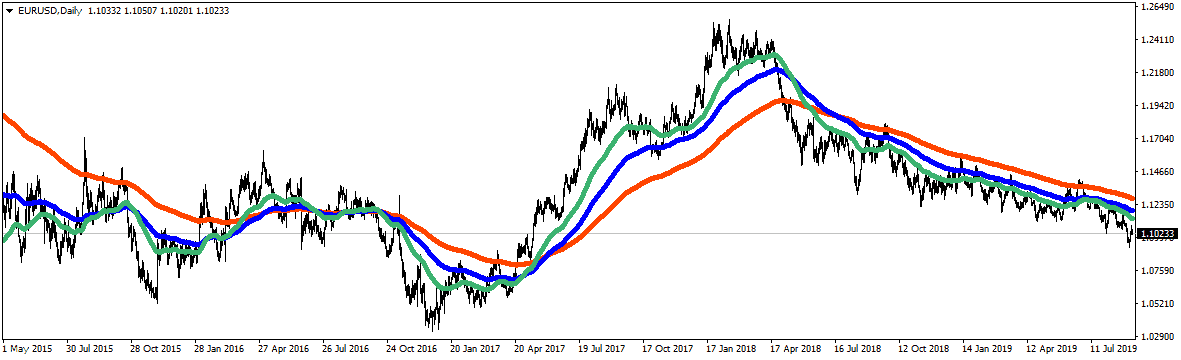
To make it simpler, MA always follows the prevalent market prices. This indicator helps you get a clear picture of the current market direction without making any prediction of future costs. It enables you to determine whether you should buy or sell a pair.
Pros:
- Finds the trend reversals
- Shows potential support and resistance levels
- Identifies the current trend directions
- Excellent performance on the daily chart (SMA200)
Cons:
- Slower then oscillators
- Too many variations (different periods, different results)
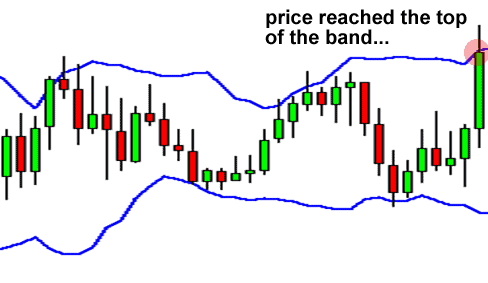
Bollinger Bands
They are a measure of market volatility. These bands come very effectively when there are no clear trends in the market. Bollinger band indicators put the prices between a couple of outer bands in a box. Prices in the market revolve continuously near the middle lines for shorter periods.
Pros
Effective when the currency pair is traded in its range in a parallel market.
Cons
Poor results in a strong volatility market or when market trends are robust.
Moving Average Convergence/Divergence (MACD) and RSI Relative Strenght index
This helps measure the significant driving forces in the market. This is based on the MA method and shows the Oscillators. They are offered in a box separately. Once these oscillators go very high, they also come down.
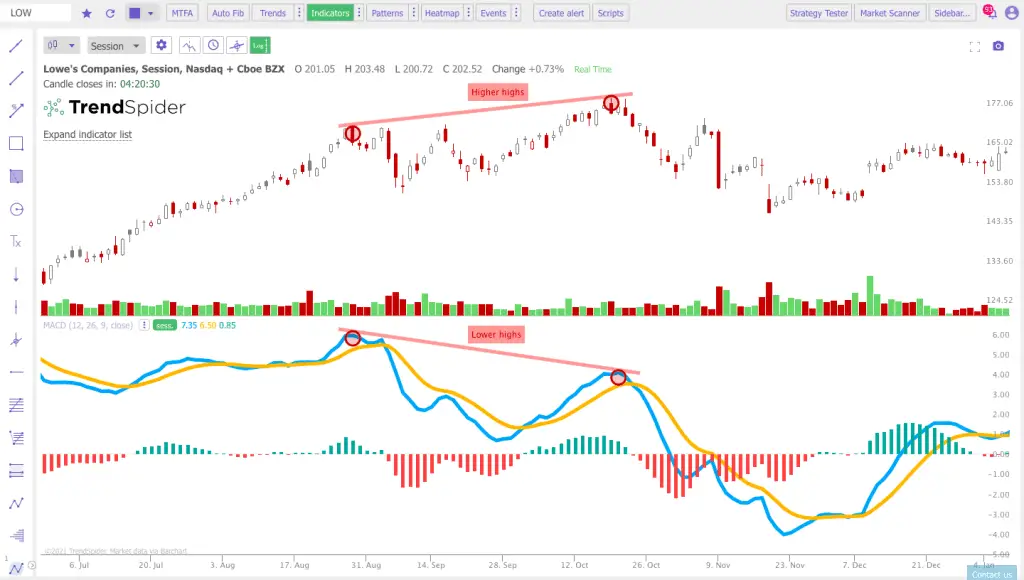
MACD effectively measures market trends and momentum. Having MACD on your chart could strengthen your trading strategies and systems. RSI is a well-used indicator in the forex market, like MACD. You can read in detail about the RSI indicator on our website.
Pros
- Used in both trending and ranging markets
- Learning oscillators gets easy with MACD
- Excellent for determining divergence
Cons
Signals may arrive late and hence do not follow strong market moves
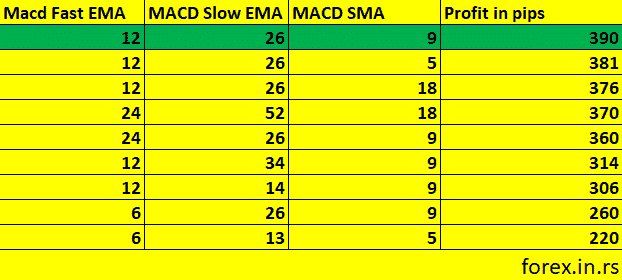
Recently we created one analysis, what is the best MACD settings, and we got this Table:
I suggest you read our article to learn more about is forex trading is profitable!
Conclusion
So, in the end, a trader has to consider all the fundamental and technical factors in market analysis for a profitable trade. The technical indicators mentioned above are the key to thriving and stable forex trade. Making the best use of all the research and indicators at your disposal is the basis of a successful forex trader. Nobody knows what the best forex indicator is. Indicators are only tools to help us see the market better, without distraction, to help us identify trends or changes in prices and volume.

He is an expert in financial niche, long-term trading, and weekly technical levels.
The primary field of Igor's research is the application of machine learning in algorithmic trading.
Education: Computer Engineering and Ph.D. in machine learning.
Igor regularly publishes trading-related videos on the Fxigor Youtube channel.
To contact Igor write on:
igor@forex.in.rs
