A breakout is anything unusual. Similarly, when a stock price goes beyond a defined resistance or support level with increased volume, it is a breakout. When the price rises after it breaks a certain level of resistance in Forex trading, we call it a Forex breakout. Forex breakouts can also occur when specific levels, like resistance and support, the Fibonacci, or the pivot points, are breached.
What is Breakout?
Breakout in trading represents a price movement where the price of an asset breaks through a significant level of support or resistance. For example, if the price rises in the last 24 hours on an hourly chart, and if the price breaks the last 24 hours’ trendline resistance, then a breakout occurs.
Breakout is sometimes tricky to figure out because sometimes it is tough to distinguish between consolidation and breakout. It is a technical analysis term traders use to identify potential trading opportunities. When a breakout occurs, traders often look to enter a position in the direction of the breakout, anticipating further price movement in that direction.


Breakouts can be identified through various technical analysis tools, such as trend lines, moving averages, and chart patterns. Traders may also use indicators like the Relative Strength Index (RSI) or the Moving Average Convergence Divergence (MACD) to confirm the breakout.


It is important to note that breakouts are not always successful, and false breakouts can occur. Traders should exercise caution and use appropriate risk management techniques when trading breakouts.
It might be a word they would never want to face or hear for a teenager, but it means a lot for a trader. Breakouts help in clearing many crucial levels on a chart. These psychological levels resonate with how the day trader might feel or what their sense might be telling them about price levels. We all know that trading is not where emotions can run successfully. Breakouts help in clearing such blocks.
While breakout day trading can help an ordinary trader transform into a brilliant trader, it can also make you face losses if you day trade quickly because the prices tend to revert to their original mark. This situation can be easily avoided by learning the art of patience—trade only when you are confident that the odds are in your favor. You need to be able to distinguish between genuine and fake breakouts. Yes, it is easier said than done, but with the help of the best Forex breakout indicators available on various platforms, you can quickly learn to do it.
Trading breakouts are not successful when the market is not trending. It will also work when the market conditions are range-bound; the price action needs to be close to the upper end of the market range. If the market conditions are right, the following strategies and indicators can help you form successful trading strategies.

The best indicators for breakout trading
Breakout Trading Indicators are MACD, RSI, Volume indicator, and all oscillator indicators. Traders can draw a trendline on an oscillator indicator line. If the price level breaks the trendline, then the breakout will happen.
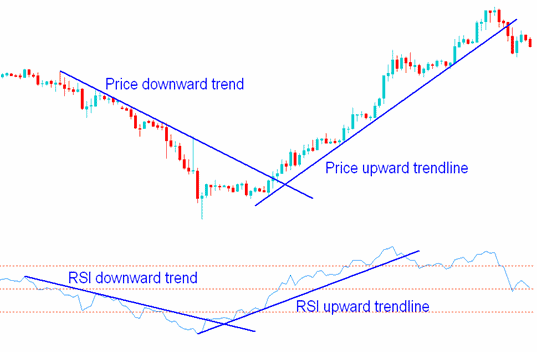
The best indicator to confirm a breakout is RSI (Relative Strength Index). If traders draw trendlines on RSI, they can get the most accurate support, resistance, or trendline breakout position.
It’s important to note that no single indicator is foolproof, and traders should always exercise caution when using any indicator, including the RSI. False signals can occur, and traders should always use appropriate risk management techniques to protect themselves from potential losses.
Below, you can see the RSI trendline breakout example:
The best breakout trading indicators are:
- It was moving Averages Convergence/Divergence (MACD) – One of the most common Forex breakout strategy indicators traders use in the MACD. While this indicator appears simple and easy to understand, it is also highly dependable. Its histogram templates indicate a rise in momentum. Though it indicates a rise, it is used to identify a reversal in trends. You can do this by looking for divergences that can be spotted when indicators and prices move in opposite directions. As the MACD indicates momentum, you will see movement upon triggering the market trends. Many traders swear by the MACd as it helps them distinguish stable trends and those that could close without warning.
- Relative Strength Index (RSI) – RSI helps in confirming reversal breakouts. Similar to the MACD, you can use this indicator to spot the divergences. Once these divergences are identified on time, it becomes easy to predict whether the trend will reverse. This indicator can check how long a trend has been overbought or oversold. The market is considered overbought if the RSI value is above 70 and oversold if the value is 30.
- The Volume Indicator: Both veteran and new traders consider volume an essential indicator. You can conduct volume analysis with it and help assess trend health. A volume-related tool, the Volume-Weighted Moving Average (VWMA), can enable you to identify breakouts.
Swing traders and intraday traders regularly participate in breakout trading. It works perfectly in a choppy market, allowing traders to keep their investments safe.
How to Avoid False Breakouts in Forex?
To avoid false breakout, traders can apply the following ten rules:
- Wait for Confirmation: Traders should wait for confirmation before entering a trade based on a breakout. This means waiting for the price to close above or below the breakout level before entering a position.
- Look for Volume Confirmation: Traders should also look for volume confirmation when trading breakouts. If the breakout occurs with low volume, it may be a false signal. High volume on a breakout can indicate a true trend continuation.
- Use Multiple Timeframes: Traders should use multiple timeframes to confirm breakouts. A breakout on a shorter timeframe may be a false signal, but if confirmed on a higher timeframe, it is more likely to be a valid signal.
- Identify Key Levels: Traders should identify critical support and resistance levels before trading breakouts. These levels can act as barriers to price movement and should be closely monitored for potential breakouts.
- Avoid Trading During Low Volatility Periods: Trading during low volatility periods can increase the risk of false breakouts. Traders should avoid trading when the market is quiet and wait for higher volatility periods when trading breakouts.
- Create trades that follow the main trend. For example, buy a position that shows a breakout on the 30-minute chart and follows the bullish trend on the Daily chart.
- Entry in the position if fundamental analysis and current economic news are on your side of the trade.
- The stronger the support or resistance breakout, the less likely it is to be a false breakout. For example, if the price has broken a 30-day high, it is less likely to be a false breakout than if the price breaks a 1-day high.
- The probability of being a false breakout is negligible if the price exceeds broken resistance or support.
- Use Technical Indicators: Traders can use technical indicators such as the Relative Strength Index (RSI), Moving Average Convergence Divergence (MACD), and Bollinger Bands to confirm breakouts and avoid false signals.

He is an expert in financial niche, long-term trading, and weekly technical levels.
The primary field of Igor's research is the application of machine learning in algorithmic trading.
Education: Computer Engineering and Ph.D. in machine learning.
Igor regularly publishes trading-related videos on the Fxigor Youtube channel.
To contact Igor write on:
igor@forex.in.rs
