Forex Education

Trading industry knowledge. Learn forex trading, investing in stocks, commodities.

  • Home
  • Choose a broker
  • Best Forex Brokers
  • Learn trading
  • Affiliate
  • Contact
  • About us
Home » Education » What is the Most Accurate MT4 Indicator?

What is the Most Accurate MT4 Indicator?

by Fxigor

Table of Contents

  • What is the Most Accurate MT4 Indicator?
  • The Alligator Indicator
  • Bollinger Bands
  • Equidistant Channel
  • Average Directional Index
  • Conclusion

MT4 Indicators are the most commonly used tools for automated trading on MT4. Indicators are used in trading to evaluate the market, analyze price charts and help traders to make decisions.

Indicators are technical tools that use mathematical formulas to calculate a value or generate a signal which can be used to identify a specific price pattern or trend. Usually, indicators plot important price levels, lines on the chart, and flashy colors to give traders the edge. However, indicators are not tools that can make predictions.

BEST BROKERS REVIEWS
avatrade ad gold trading
Trillion Dollar Club - Invest & Trade Stocks, Crypto, Forex
trade oil ads
cfd stocks trade - ad
avatrade ad gold trading

What is the Most Accurate MT4 Indicator?

The most accurate indicators are major oscillators such as RSI, MACD, and ATR. All major indicators plot information on the chart that traders do not use to predict future prices, only to visually present important price changes during the time, patterns or divergence. Hence, major free indicators are accurate not in prediction but in the amount of important information they bring.

avatrade ad gold trading
Trillion Dollar Club - Invest & Trade Stocks, Crypto, Forex
trade oil ads
cfd stocks trade - ad
avatrade ad gold trading

BEST BROKERS REVIEWS
free course banner

fxpro android ad
fxpro android ad
100% bonus hotforex
100% bonus hotforex
trade ETF
supercharged bonus hotforex ad
hfm zerpo spread ad
gold trading hotforex ad
crypto trading capital ad
trade oil ads
cfd stocks trade - ad
avatrade ad gold trading
exness stable spread ad
trade metals ad
trade crypto icm

Remember, if the indicator is based on the calculation of past price performance using simple equations (moving average, oscillators, etc. ), that indicator should not be used as a prediction tool. However, if you, as a trader, use machine learning models, based on historical databases and various inputs, that kind of prediction model can be less or more accurate.

accuracy in machine learning

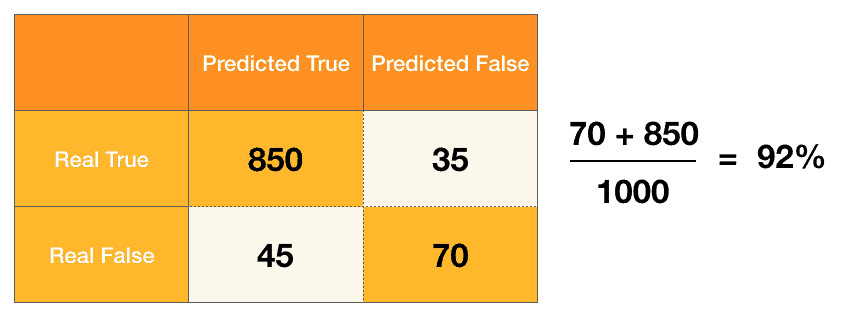
So if traders want to create accurate indicators using machine learning algorithms is complicated, such as:

avatrade ad gold trading
Trillion Dollar Club - Invest & Trade Stocks, Crypto, Forex
trade oil ads
cfd stocks trade - ad
avatrade ad gold trading

forex or stock trading machine learning creating accurate models diagram

BEST BROKERS REVIEWS

avatrade ad gold trading
Trillion Dollar Club - Invest & Trade Stocks, Crypto, Forex
trade oil ads
cfd stocks trade - ad
avatrade ad gold trading

free course banner
fxpro android ad
fxpro android ad
100% bonus hotforex
100% bonus hotforex
trade ETF
supercharged bonus hotforex ad
hfm zerpo spread ad
gold trading hotforex ad
crypto trading capital ad
trade oil ads
cfd stocks trade - ad
avatrade ad gold trading
exness stable spread ad
trade metals ad
trade crypto icm

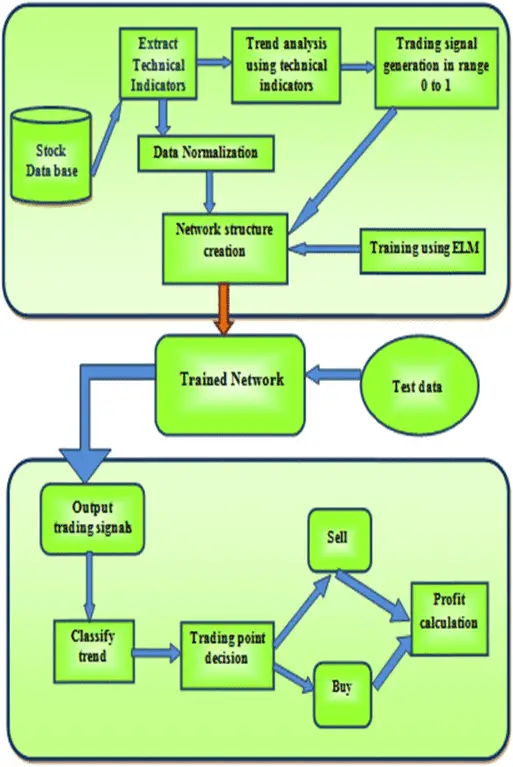
But let us keep to standard indicators that use simple formulas to remove noise and represent trends in a simple way. The best indicators show a lot of information, and they are simple.

For example, the Relative Strength Index RSI measures the speed of price change. Additionally, you can evaluate the trend’s strength using the same indicator. Hence, RSI removes the chart’s noise and provides the trader with additional information. Because of that, we can assume why this indicator is one of the most used free indicators.

The relative strength index, or RSI, is a technical analysis indicator that measures a stock’s momentum over time. It compares the current price of an asset to its past performance and indicates when it may be due for a significant move in either direction. Welles Wilder created the RSI, initially published in 1978 in his book “New Concepts in Technical Trading Systems.”

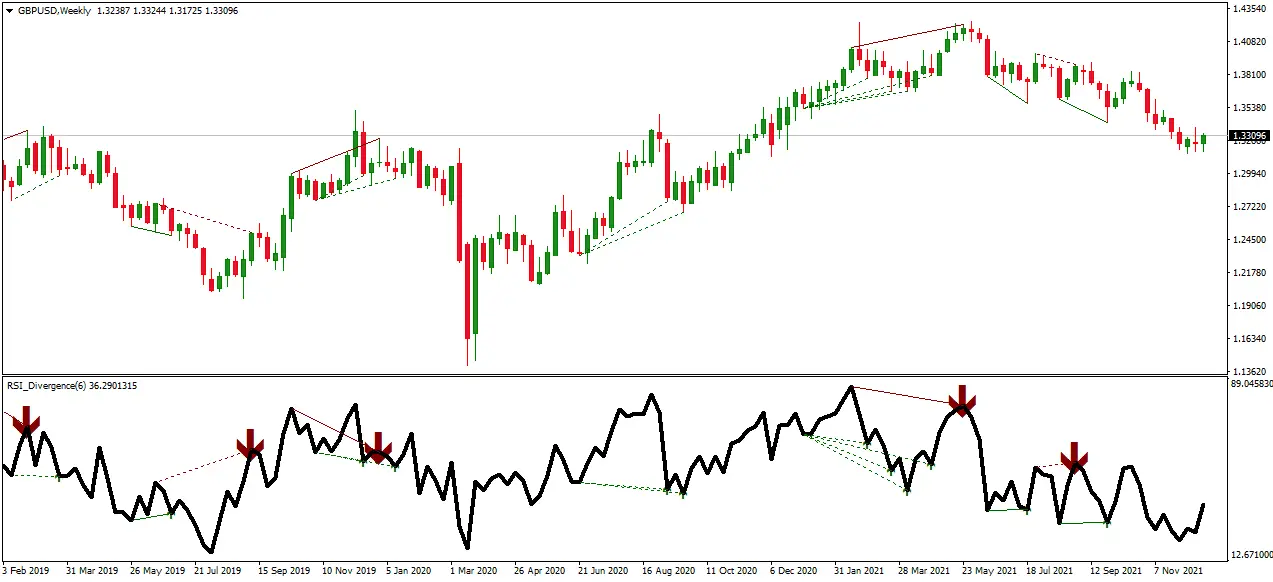
Traders use this indicator to detect trends on the chart:

RSI trend lines

avatrade ad gold trading
Trillion Dollar Club - Invest & Trade Stocks, Crypto, Forex
trade oil ads
cfd stocks trade - ad
avatrade ad gold trading

avatrade ad gold trading
Trillion Dollar Club - Invest & Trade Stocks, Crypto, Forex
trade oil ads
cfd stocks trade - ad
avatrade ad gold trading

fxpro android ad
fxpro android ad
100% bonus hotforex
100% bonus hotforex
trade ETF
supercharged bonus hotforex ad
hfm zerpo spread ad
gold trading hotforex ad
crypto trading capital ad
trade oil ads
cfd stocks trade - ad
avatrade ad gold trading
exness stable spread ad
trade metals ad
trade crypto icm


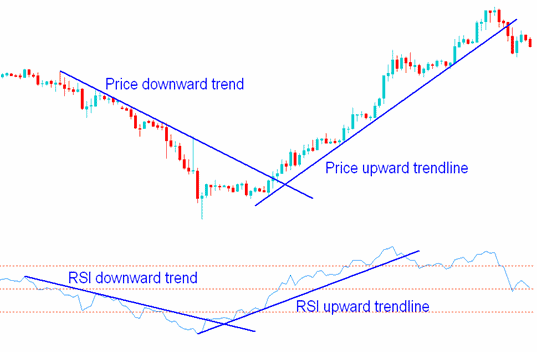
Usually, hidden divergence can help in the detection of the future trend shift:

RSI DIVERGENCE INDICATOR ON THE CHART


The Alligator Indicator

The Alligator Indicator is a combination of three moving averages. It has three lines called the “jaws,” “teeth,” and “lips.” It’s a great tool to help you determine the trend. The Alligator lines (also known as moving averages) are based on price action to be used for intraday and end-of-day trading.

alligator indicator on mt4 chart

avatrade ad gold trading
Trillion Dollar Club - Invest & Trade Stocks, Crypto, Forex
trade oil ads
cfd stocks trade - ad
avatrade ad gold trading

fxpro android ad
fxpro android ad
100% bonus hotforex
100% bonus hotforex
trade ETF
supercharged bonus hotforex ad
hfm zerpo spread ad
gold trading hotforex ad
crypto trading capital ad
trade oil ads
cfd stocks trade - ad
avatrade ad gold trading
exness stable spread ad
trade metals ad
trade crypto icm

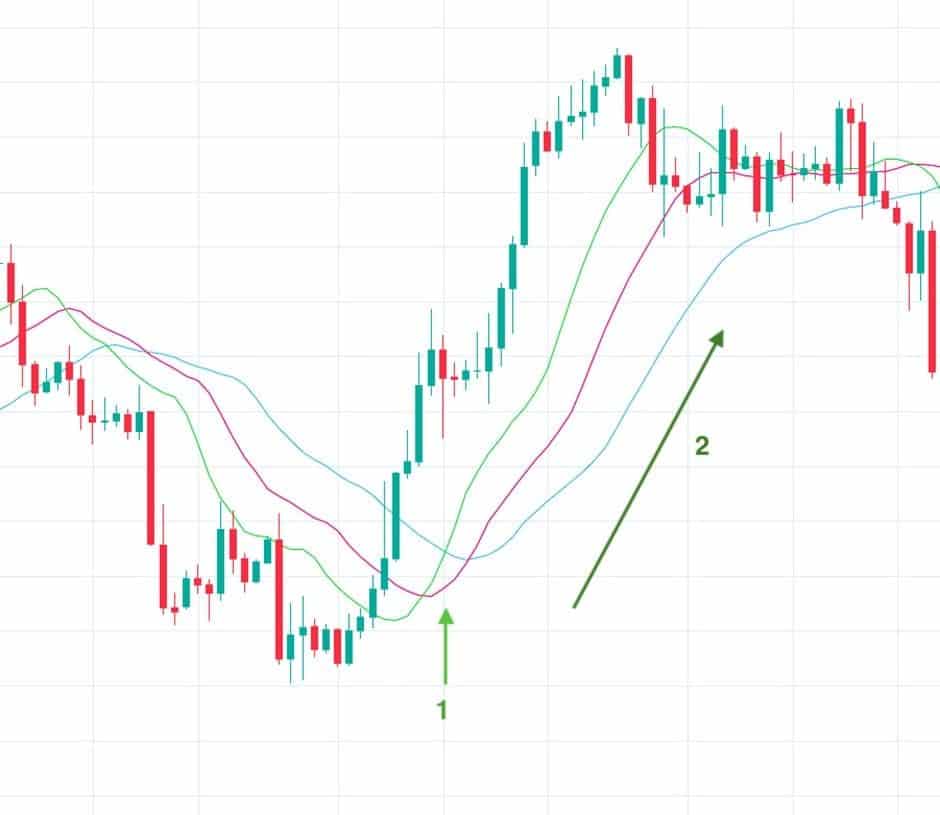
The Alligator indicator combines two short-term averages (the ‘jaw’ and ‘teeth’) and one long-term average (the ‘lips’). The middle line represents the average of the two short-term lines combined with some smoothing effect from using EMA instead of SMA. It’s done so it won’t react too quickly when prices change direction but still respond sufficiently fast enough without having too much lag time.
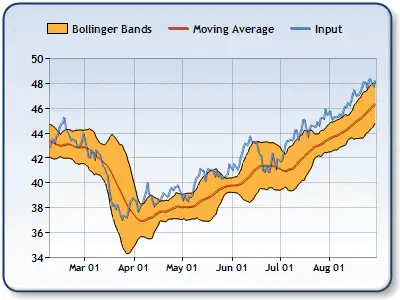
Bollinger Bands

Bollinger Bands is a technical analysis tool developed by John Bollinger in the early 1980s. It uses simple moving averages and standard deviations to determine upper and lower bands around a price series. The bands adjust to market conditions, so they aren’t static values like other indicators.

bollinger-resistance-start

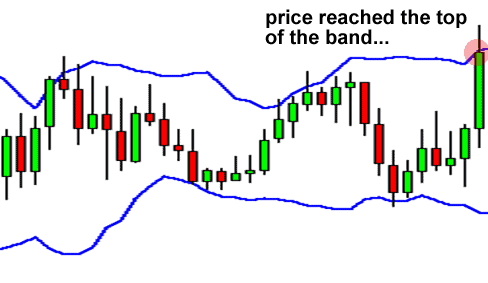
Bollinger Bands are used to measure market volatility, so you’ll see traders using them when they’re looking for an entry into a trade or when they want to exit one.

Bollinger Bands forex indicator

Equidistant Channel

The Equidistant Channel is a technical analysis tool that measures the price’s volatility. It uses two parallel lines, one above and one below the price. These lines are drawn at an equal distance, and the average range of the price determines this distance.

fxpro android ad
fxpro android ad
100% bonus hotforex
100% bonus hotforex
trade ETF
supercharged bonus hotforex ad
hfm zerpo spread ad
gold trading hotforex ad
crypto trading capital ad
trade oil ads
cfd stocks trade - ad
avatrade ad gold trading
exness stable spread ad
trade metals ad
trade crypto icm

Equidistant Channel

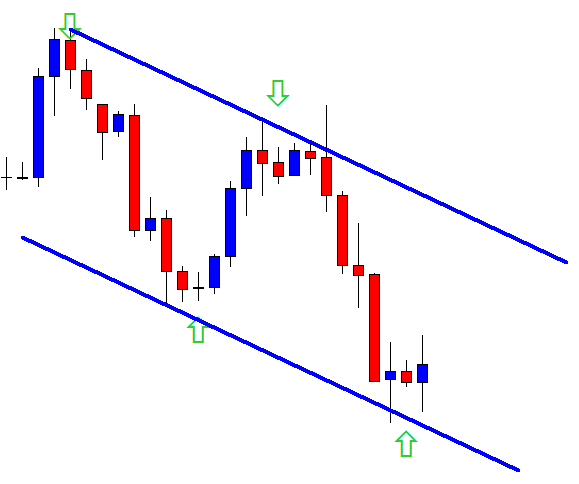
To use this indicator in your trading strategy, you should determine how far your currency moves up and down on average. To do this, you need to sum up all candlesticks formed during a specific time (for example, 20 days). Then divide this sum by 20*100 (in percent) or 100, depending on what information is provided in your MT4 terminal window.


Average Directional Index

The Average Directional Index (ADX) is a trend strength indicator that looks at the relationship between positive and negative price movements. The ADX indicator is an oscillator that ranges from 0 to 100, with readings above and below 30 indicating a strong trend. An ADX reading of 0 means no trend, while readings above 60 indicate a strong trend.

Average Directional Index

fxpro android ad
fxpro android ad
100% bonus hotforex
100% bonus hotforex
trade ETF
supercharged bonus hotforex ad
hfm zerpo spread ad
gold trading hotforex ad
crypto trading capital ad
trade oil ads
cfd stocks trade - ad
avatrade ad gold trading
exness stable spread ad
trade metals ad
trade crypto icm

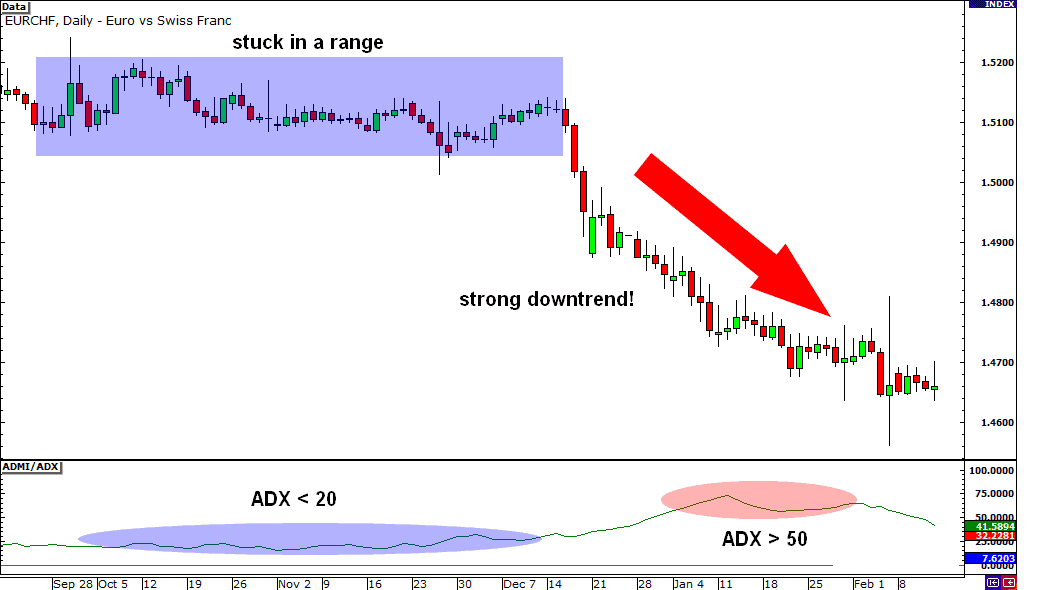
The ADX indicator is considered lagging because it does not pick up on changes in market direction until after they have already occurred. It’s also important to note that the average directional index does not predict future trends; instead, it helps traders determine how long existing trends will continue by measuring their momentum and strength.

Conclusion

Indicators are used by traders as a tool to confirm their trade decisions. They are not strategies, but tools traders use to identify potential trades based on technical analysis. While many different indicators are available on MetaTrader 4 (MT4), these are some of the most popular among forex traders, and their accuracy will vary from trader to trader.

The best way to find out which indicator works best for your style is by testing them all! You will need a demo account so that you don’t put real money at risk when testing different systems or strategies—this way, it won’t matter whether or not the system generates profits or losses because it’s all happening on paper or in cyberspace.

  • Author
  • Recent Posts
Fxigor
Fxigor
Trader at Leanta Capital
Igor has been a trader since 2007. Currently, Igor works for several prop trading companies.
He is an expert in financial niche, long-term trading, and weekly technical levels.

The primary field of Igor's research is the application of machine learning in algorithmic trading.

Education: Computer Engineering and Ph.D. in machine learning.

Igor regularly publishes trading-related videos on the Fxigor Youtube channel.

To contact Igor write on:
igor@forex.in.rs
Fxigor
Latest posts by Fxigor (see all)
  • What is Forex Trader?
  • General Characteristics of Precious Metals – Precious Metals Criteria
  • Is Titanium a Precious Metal?

Related posts:

  1. How Does ADR Indicator Work? – Download ADR Indicator
  2. Balance of Power Indicator and Strategy – BOP Indicator
  3. Symbol Changer Indicator for MT4
  4. MBFX Timing Indicator – Free download MT4 Indicator
  5. Best Trend Reversal Indicator – Download MT4 Reversal Diamond Indicator
  6. Download QQE Indicator! How to use QQE Indicator?
  7. Download Currency Pair Correlation Indicator!
  8. Download Forex Reversal Indicator for MT4
  9. What is Trix Indicator? – Download Trix Indicator for MT4
  10. Traders Dynamic Index Indicator – Download TDI Indicator
  11. How to Add Custom Indicator to MT4 iPhone?

Filed Under: Education

Trade gold and silver. Visit the broker's page and start trading high liquidity spot metals - the most traded instruments in the world.

Trade Gold & Silver

Diversify your savings with a gold IRA.

Gold & silver portfolio-building assistance from product professionals.

VISIT GOLD IRA COMPANY If you want to trade stocks try: TRADE IDEAS

fxpro android ad
fxpro android ad
100% bonus hotforex
100% bonus hotforex
trade ETF
supercharged bonus hotforex ad
hfm zerpo spread ad
gold trading hotforex ad
crypto trading capital ad
trade oil ads
cfd stocks trade - ad
avatrade ad gold trading
exness stable spread ad
trade metals ad
trade crypto icm

Website categories

Main Forex Info

  • Forex Calendar 2022
  • Forex Holidays Calendar 2022 – Holidays Around the World
  • Non-Farm Payroll Dates 2023.
  • Fed Meeting Schedule 2023. Dates! – FOMC Dates
  • Key Economic Indicators For a Country
  • What is PAMM in Forex?
  • Stock Exchange Trading Hours

Main navigation:

  • Home
  • About us
  • The Best Forex Brokers of 2023 (Ranked & Reviewed)
  • Free Forex Account Without Deposit in Autumn of 2023.
  • Best Forex Affiliate Programs in 2023.
  • Best Forex Brokers by Monthly Traffic of 2023
  • Brokers That Accept PayPal Deposits
  • Forex brokers reviews
  • Investment
  • Education

Forex social network

  • RSS
  • Twitter
  • FxIgor Youtube Channel
  • Privacy Policy
  • Contact us

Spanish language

Spanish language website
Risk Warning: Trading leveraged products such as Forex and CFDs may not be suitable for all investors as they carry a high degree of risk to your capital. Trading such products is risky and you may lose all of your invested capital. Before deciding to trade, please ensure that you understand the risks involved, taking into account your investment objectives and level of experience.

Copyright Forex.in.rs 2007

Privacy Policy