Table of Contents
Momentum refers to the strength and persistence of an asset’s price movement in a particular direction. It is a fundamental principle in technical analysis traders use to identify potential opportunities and generate profits.
The concept of momentum is rooted in the idea that trends tend to persist in financial markets, whether upward (bullish) or downward (bearish). Traders analyze the historical price data of an asset to identify patterns and determine the strength of its momentum. By understanding and utilizing momentum indicators, traders can potentially predict the future price movements of an asset and make profitable trades.


Momentum trading is a popular strategy employed by many traders. It involves buying assets with upward solid momentum and selling assets with significant downward momentum. This strategy assumes that assets with strong momentum will continue to move in the same direction, allowing traders to capitalize on the trend.


What is the Best Momentum Indicator?
The best momentum indicator is Relative Strength Index (RSI) because it is effective in identifying divergence and early detects the speed (velocity) and change (magnitude) of directional price movements. In addition, compared to some other momentum indicators, RSI tends to generate fewer false signals.
I believe presented indicators are widely used in trading and scientific research. For example, exciting results can see using RSI as a momentum indicator in a research paper, Technical analysis, and the Spanish stock exchange: testing the RSI, MACD, momentum, and stochastic rules using Spanish market companies.
RSI indicator can outperform the buy-and-hold strategy in the stock market as well. We can see excellent results testing RSI, outperforming the DJIA, the FTSE100, and the NK225 for five of the six years examined.
Advantages of the Relative Strength Index (RSI) compared to other momentum indicators:

- Simplicity: RSI is a simple and straightforward indicator that measures the speed and change of price movements. It’s easier to understand and use, especially for beginners in technical analysis.
- Overbought/Oversold Levels: RSI is known for its clear indication of overbought and oversold conditions, which are not always as clearly defined in other indicators.
- More Responsive: RSI can be more responsive to price changes than some other momentum indicators like the MACD. This can provide earlier signals for traders.
- Failure Swings: RSI has unique ‘failure swing’ patterns that can signal reversals in the trend, providing a different perspective than many other momentum indicators.
- Centerline Crossovers: RSI’s centerline crossovers can signal momentum shifts and be helpful in trend identification.
- Fewer False Signals: Compared to other momentum indicators, RSI tends to generate fewer false signals because it’s more focused on measuring the speed of price movements rather than the magnitude.
- Divergence: RSI is effective in identifying divergence, which can be a signal of a potential reversal. This is where the price continues to rise or fall, but the RSI moves in the opposite direction.
- Trending and Ranging Markets: RSI is a versatile tool that can be used effectively in trending and ranging markets, making it more flexible than other indicators.
- Fewer Parameters to Adjust: RSI generally has fewer parameters to adjust than other indicators like the MACD, making it less complex to fine-tune.
- Universal Application: RSI can be used across various time frames and asset classes (stocks, forex, commodities, etc.), showcasing its versatility.
Best Momentum Indicator List
The best Momentum indicators based on the frequency of use in the trading environment:
- Relative Strength Index (RSI)
- Moving average convergence divergence (MACD)
- Stochastics
- Commodity Channel Index (CCI)
Using these indicators, traders make better decisions, are more comfortable finding the edge, analyze the impact, and get a better look and the chart.
Most indicators are oscillators. They do not predict market price; they explain better price charts and technical indicators can help traders pick the proper entry and exit position.
Momentum indicators Advantages
- Early trend identification: Momentum indicators can help traders spot the beginning of a new trend before it becomes apparent on price charts. This allows traders to enter trades early and capture more significant price movements.
- Confirmation of price action: By confirming price movements, momentum indicators provide additional evidence to support a trader’s decision. This can increase confidence in taking a particular trade.
- Overbought/oversold conditions: Momentum indicators such as the Relative Strength Index (RSI) or Stochastic oscillator help identify when an asset is overbought or oversold. This information can help determine when a price correction or reversal is likely to occur.
- Divergence signals: Momentum indicators can reveal divergences between the indicator and the price chart, indicating a potential trend reversal. This can be a powerful signal for traders to adjust their positions accordingly.
- Objective measurements: Momentum indicators provide objective measurements based on mathematical formulas, eliminating emotional biases that can influence trading decisions. This makes them useful for both novice and experienced traders.
- Scalping and day trading: Momentum indicators are commonly used by scalpers and day traders due to their ability to capture short-term price movements. These indicators can help traders identify quick opportunities and make rapid trading decisions.
- Portfolio management: Momentum indicators can also assist in managing a portfolio of assets by indicating which assets are showing strong momentum and should be given more weight in the portfolio.
- Risk management: By highlighting overbought or oversold conditions, momentum indicators can assist in setting stop-loss orders or profit targets, helping traders manage risk effectively.
The momentum indicators will indicate the forex rates’ movement over time, and the strength of these movements through the rates may increase or decrease. These indicators are helpful since they help analysts and traders determine the point where the market is reversing. At the reversing point, there is a divergence between the momentum and movement in forex rates.
Relative Strength Index Momentum Indicator
The Relative Strength Index (RSI) is a technical indicator used in the analysis of financial markets. It can measure the speed (velocity) and change (magnitude) of directional price movements. In addition, it allows traders to quantify the market’s momentum, indicating bullish or bearish conditions.
RSI is a momentum oscillator that measures the speed and change of price movements. It is used to identify overbought or oversold conditions in a market. The RSI is calculated using average price gains and losses over a period. Here are the basic steps used in the calculation:
- The first step in calculating RSI is calculating the average gain and loss over the specified period. The default period is typically 14 periods on any chart timeframe.
- For each period, if the closing price is higher than the previous close, the difference in closes is counted as a gain. Conversely, the difference is lost if the closing price is lower than the previous one.
- Calculate the first average gain and average loss. The first calculations for average gain and loss are simple 14-period averages.
- Calculate the subsequent average gains and losses. After the first calculation, the following calculations are based on the prior averages and the current gain loss: Average Gain = [(previous Average Gain) x 13 + current Gain] / 14 Average Loss = [(previous Average Loss) x 13 + current Loss] / 14
- With the average gain and average loss, RSI can now be calculated: RSI = 100 – (100 / (1 + (Average Gain / Average Loss)))
The RSI will produce a value between 0 and 100. If the RSI is above 70, the asset is overbought, and a price reversal or slowdown might be expected. Conversely, if the RSI is below 30, the asset is oversold, and a price reversal or climb might be expected.
The Relative Strength Index (RSI) (full review on our website) is another popular momentum indicator. Like the MACD, it is an oscillator that measures the speed of the forex rate changes. However, if the RSI reading drops below 30, it could indicate that traders and investors have oversold the currency.
Traders use the RSI to monitor the divergence when the indicator crosses the centerline. In addition, the the RSI indicator can be used to calculate the currency pair’s strength.
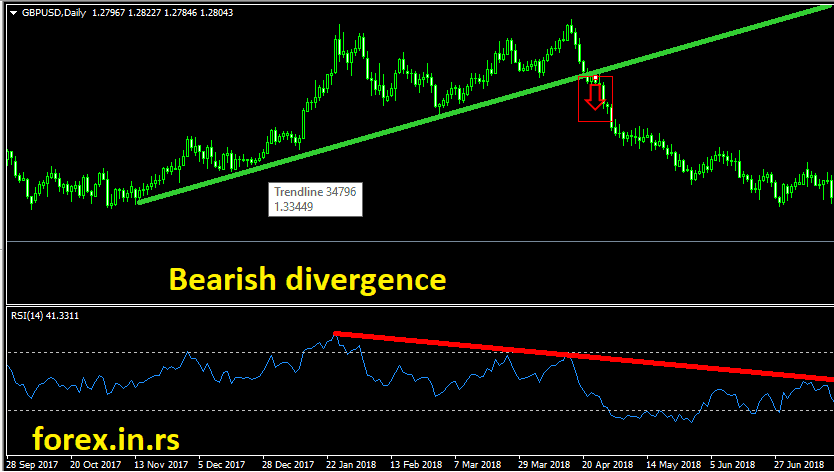
Example of RSI bearish divergence :
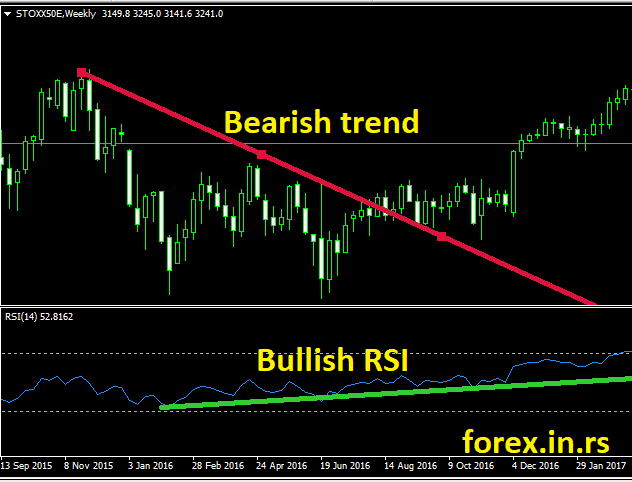
Example of RSI bullish divergence:
Moving Average Convergence Divergence (MACD)
The Moving Average Convergence Divergence (abbreviated as MACD – see analysis) is a popular momentum indicator. The MACD uses two moving averages to produce an oscillator, deducting the longer average from the shorter average. As a result, these averages will overlap, converge, and move away, indicating momentum.
MACD Features:
- Trend-following Indicator: The MACD is a momentum-based, trend-following indicator. It helps traders identify the direction of market trends.
- Two Components: The MACD consists of two components: the MACD line and the signal line. The MACD line is the difference between two exponential moving averages (typically 12-day and 26-day), and the signal line is a 9-day exponential moving average of the MACD line.
- Histogram: MACD also includes a histogram representing the difference between the MACD and signal lines. The histogram visually represents when the two lines are converging or diverging.
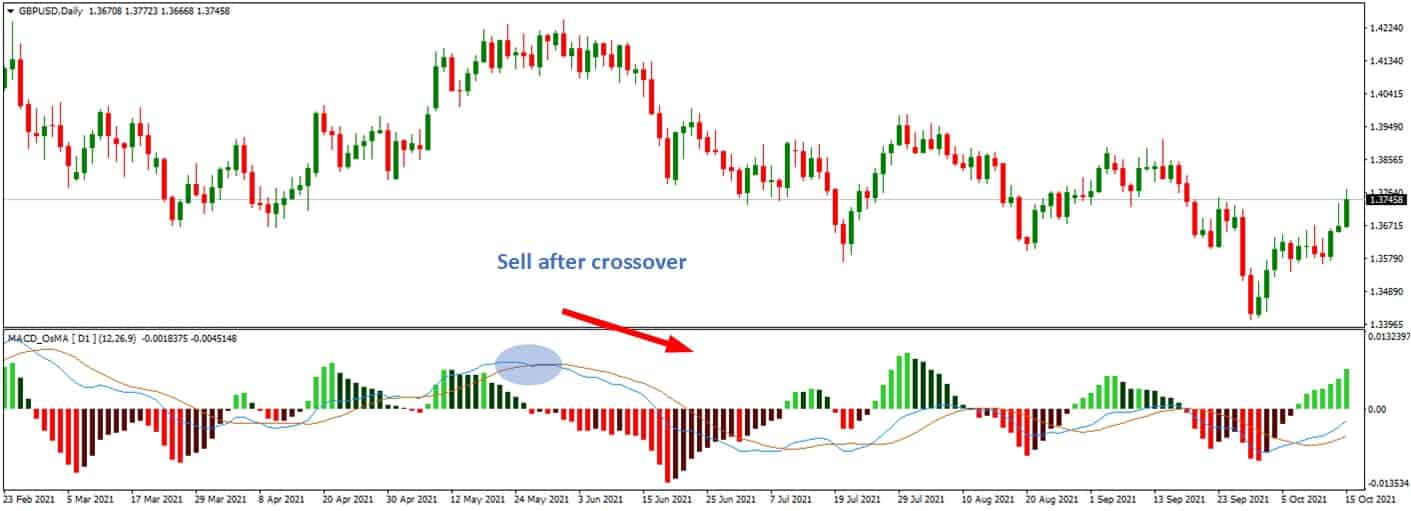
- Signal Generation: The MACD generates trading signals based on the crossovers between the MACD and signal lines. When the MACD line crosses above the signal line, it’s considered bullish. When the MACD line crosses below the signal line, it’s considered a bearish signal.
- Convergence and Divergence: The MACD helps traders identify convergence (when the two moving averages move closer together) and divergence (when the two moving averages move apart). This helps to identify potential market reversals.
- Zero-Crossover: The MACD also signals when the MACD line crosses the zero line. This can be a solid bullish or bearish signal, depending on the direction of the crossover.
- Lagging and Leading Characteristics: The MACD combines both lagging and leading characteristics. The moving averages are lagging indicators, as they are based on past prices. In contrast, the histogram, representing the difference between the two moving averages, can be considered a leading indicator, often signaling potential trend changes before they occur.
- Versatility: The MACD can be used in all markets (stocks, commodities, forex, etc.) and in various time frames.
- Limitations: MACD isn’t infallible and can generate false signals like all technical indicators. It’s best used with other technical indicators and market analysis techniques.
While the trader or analyst may choose any period, they typically use the exponential moving average (EMA) for 26 and 12 days. The resulting MACD line is graphed against a 9-day EMA, which is used to detect when the price movement will turn. The histogram determines the weakening uptrend or downtrend when the histogram is positive but moving downward, and the histogram is negative but moving upward, respectively.
Average Directional Index (ADX)
Welles Wilder created the Average Directional Index (ADX) as part of his Directional Movement system. It consists of a Minus (-DI) and (+DI) directional indicator, ADX, which measures price movement direction, and momentum -DI and +DI are derived by comparing the consecutive lows and the corresponding highs.
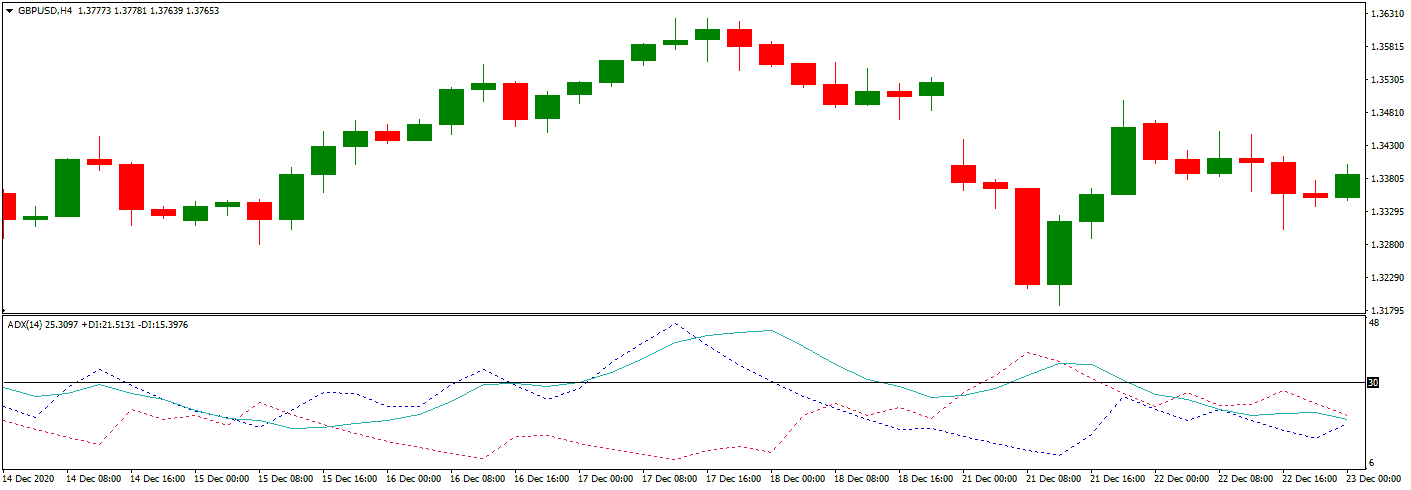
The ADX is calculated from the smoothed +DI and -DI averages. If the ADX value is more than twenty, it indicates a market trend; if ADX is less than 20, the market is considered directionless. The ADX only measures the strength of the movement, not its direction.
- The Average Directional Index (ADX) is a technical indicator used to measure the strength and direction of a trend in a financial instrument.
- ADX is a non-directional indicator, meaning it does not provide information about the trend’s direction but focuses on its strength.
- The ADX indicator consists of three lines: the ADX line, the Plus Directional Indicator (+DI), and the Minus Directional Indicator (-DI).
- The ADX line typically ranges between 0 and 100. A higher ADX value indicates a stronger trend, while a lower value suggests a weaker or non-existent trend.
- A rising ADX value indicates an increasing trend strength, while a declining value suggests a weakening trend.
- The +DI line measures the strength of the upward price movement, while the -DI line measures the strength of the downward price movement.
- When the +DI line is above the -DI line, it suggests that the upward price movement is more robust, indicating a bullish trend. Conversely, the -DI line above the +DI line suggests a stronger downward price movement, indicating a bearish trend.
- The crossover of the +DI and -DI lines can signal potential trend reversals. For example, when the +DI line crosses above the -DI line, it may indicate a shift from a bearish to a bullish trend and vice versa.
- ADX can also identify consolidations or periods of low volatility when the ADX line is below a certain threshold, typically around 20 or 25.
- Traders often use the ADX indicator with other technical analysis tools to confirm trends, identify trend reversals, and manage risk in their trading strategies.
Conclusion
In summary, momentum plays a significant role in trading and is crucial concept traders use to identify and capitalize on market trends. Traders can make informed decisions and potentially generate profits by analyzing historical price data and utilizing various momentum indicators. However, traders must also be mindful of the risks associated with momentum trading and employ proper risk management techniques to safeguard their investments.
While we limit our evaluation to foreign exchange only, it is reasonable to assume that the other primary asset classes included in a typical managed futures portfolio, namely, fixed income, commodities, and stock indices, would benefit from a combination of momentum macro/fundamental strategies.

He is an expert in financial niche, long-term trading, and weekly technical levels.
The primary field of Igor's research is the application of machine learning in algorithmic trading.
Education: Computer Engineering and Ph.D. in machine learning.
Igor regularly publishes trading-related videos on the Fxigor Youtube channel.
To contact Igor write on:
igor@forex.in.rs
