Renko charts are a type of technical analysis charting tool traders use to chart price movements in different markets. This charting tool differs from the traditional candlestick charts in that it ignores time and volume, instead relying solely on price movements. Renko charts can benefit traders because they clearly represent support and resistance levels based on price changes, with much less noise than traditional candlestick charts. Therefore, investors often wonder whether this type of charting is more profitable than conventional methods.
To download Renko chart indicator, please visit our page.
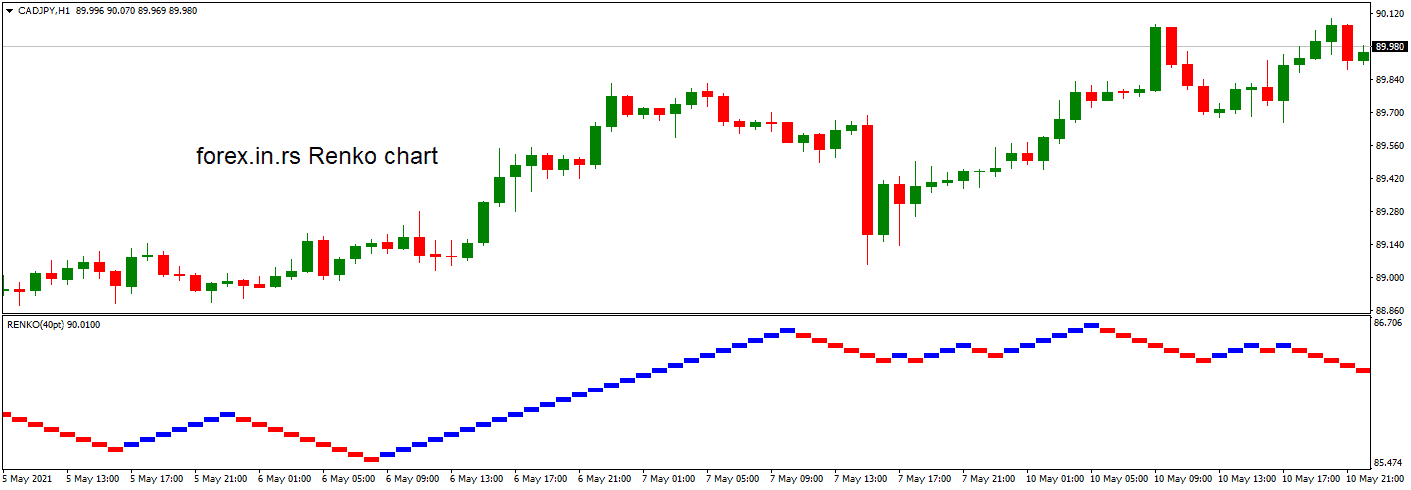
Are Renko charts profitable?
There is no statistical evidence that Renko charts are more profitable than standard candlesticks charts for traders. However, Renko charts effectively identify support and resistance levels for some traders than standard charts because of different visual representations and negligible noise.


I created Renko charts vs. candlestick chart systems for the last 100 000 hourly candles for 15 major currency pairs, and I didn’t find any statistical evidence that Renko charts are more profitable. Although trading is an individual process, some traders use indicators and different visual representations to help them make better decisions.
No statistically proven evidence exists that Renko charts are more profitable than standard candlestick charts for all traders. However, some traders have found that Renko charts offer greater insight into support and resistance levels when compared to traditional candlesticks. The primary benefit of using a Renko chart is that it eliminates much of the “noise” associated with the more conventional methods of analyzing market trends and price movements. This allows for more precise identification of both support and resistance levels and potential entry signals for traders looking to capitalize on them.
When trading with Renko charts, traders must remember that they only represent price movements without considering other factors like volume or time variation in the market. Therefore, these charts do not necessarily provide advantages over other forms of technical analysis when forecasting future price trends or predicting future market activity or performance. Instead, they are best used with other indicators, such as Moving Averages (MA) or Relative Strength Index (RSI). By combining the strengths of each indicator within a single trading strategy, investors may gain an advantage over other traders who rely solely on one method or another for their analysis.
Another disadvantage of using Renko charts is that they often require higher-level investors due to their longer-term outlooks compared to shorter-term indicators like the MACD or Stochastic Oscillator. As such, some investors may find themselves too early in entering positions just before more significant trends emerge several days or weeks later, which could result in losses if proper stop losses are not put in place at the correct times.

Additionally, long-term swing trades taken directly from a Renko chart could lead to significant losses if not appropriately managed since no indicators are built into these graphs, which would typically alert a trader before such failures occur.
In conclusion, while no statistically proven evidence suggests Renko charts are more profitable than standard candlesticks for all types of traders, many experienced investors have found success by utilizing these tools alongside other indicators and strategies to take advantage of potential opportunities within the markets at any given time. Furthermore, these graphical representations can allow for greater clarity regarding support and resistance levels than what might be obtained through standard candlestick techniques alone, thus allowing for investments that may otherwise be overlooked under conventional methods.
However, regardless of your chosen strategy, it remains essential to always consider both the risks and rewards associated with any investment before proceeding, along with setting proper stop loss orders should things not go according to plan to reduce any potential losses incurred along the way.

He is an expert in financial niche, long-term trading, and weekly technical levels.
The primary field of Igor's research is the application of machine learning in algorithmic trading.
Education: Computer Engineering and Ph.D. in machine learning.
Igor regularly publishes trading-related videos on the Fxigor Youtube channel.
To contact Igor write on:
igor@forex.in.rs
Related posts:
- Renko Charts Disadvantages
- How Do Renko Charts Work? – Download Free Renko Chart Indicator
- How to Read Forex Bar Charts?
- How to Create Profitable Trading Setups?
- 1-minute Scalping Trading Strategy Example Using EMA20
- How to Read Forex Charts?
- Which Forex Indicator is the Most Profitable ?
- The Best Stock Ticker – Live Market Charts Free
- Download Auto Support Resistance Indicator
- Forex Gap Trading Simple and Profitable
- What is Tick Data in Forex? – Tick charts
- Download Swing ZZ MT4 indicator
