We are looking for the best indicator for intraday trading! So we created a poll and gave our top traders to vote. Our email list is more than 10 years old, and all our traders are experienced traders. We asked them to pick 3 top indicators for day trading. We know that traders like to combine several indicators when they trade. This is one of the best studies for day trading that we created using our contacts (email ist).
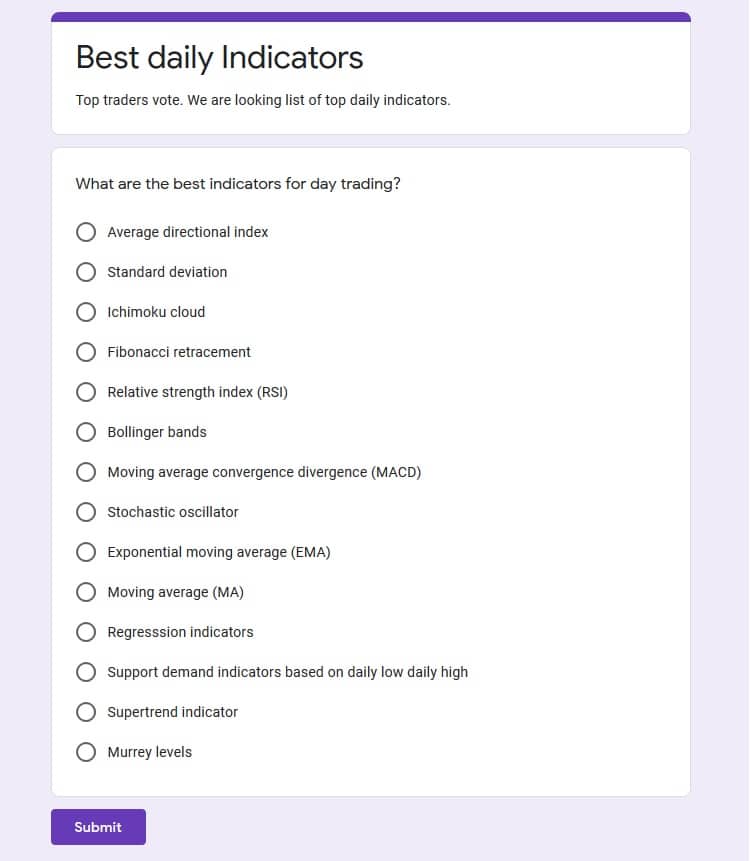
What are the best indicators for intraday trading?
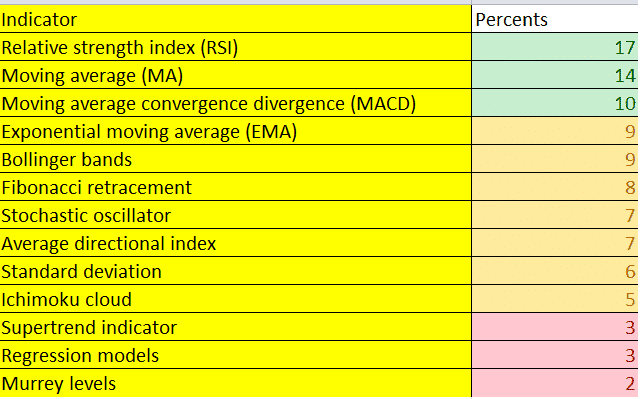
Best indicators for day trading are MACD, RSI, and Moving average based on our case study. After analyzing our survey and video conference, we concluded that the best indicators are the simplest ones, the same ones that big corporations and hedge funds use in the last several decades.


Technical indicators for day trading survey
Step 1: What indicators to use for day trading? We made the list of best trading indicators for day trading.
It is important to discover the top-day trading indicators regarding the particular approach you apply to your day trading efforts. This means that it will be necessary for you to conduct testing on several of them individually. Then it is also a good idea to conduct testing on them by combining them. For example, you may decide to continue using four that tend to be evergreen, or you otherwise may consider switching off based on the asset you wish to trade and based on the market conditions for that day.
In the first step, we asked our traders to give suggestions. Then we made a list and created a poll in Google forms :

Technical indicators for intraday trading need to have simplicity. In all situations regarding forex trading, futures trading, or day trading stocks, it is preferential to ensure that you apply simplicity in the usage of technical indicators. You may realize that your preference is to view only a paired combination of indicators for the sake of considering points of entry as well as points of exit. It is advised to apply only one such indicator within each category’s context to prevent distracting and needless repetition.
Below are text about day trading indicators, some major tips on using technical indicators for day trading.
Indicators to use for day trading are:
1. Simple moving average indicator
The simple moving average indicator is implemented for the sake of providing an identification of the direction of a price trend at present while disregarding any spikes of short term prices. Thus, the moving average indicator tends to combine the price points for a designated time period. It then performs the division of this price point by the identified number of data points to represent a singular trade line. The simple moving average can be used not only for long term positions – it can be used as one of the forex day trading indicators as well.
2. Exponential moving average
The exponential moving average is recognized as being another moving average. But it is different from the simple moving average in that the exponential moving average tends to grant more weight to current data points. This results in the data seeming more responsive to the deriving of new information. When this indicator is combined with other indicators’ implementation, exponential moving averages can help traders confirm key market moves. They can provide a gauging for the legitimacy of these market moves.
3. Stochastic oscillator
A stochastic oscillator is categorized as an indicator that compares a particular closing price about an asset in correlation to the range of the particular asset prices over an extended period of time. This displays the momentum of the trend as well as the strength of the trend. There is the usage of a scale with a range from zero to one hundred. When the reading is under twenty, this tends to indicate that the market is oversold. A reading that is higher than the rate of eighty indicates that the market is overbought.
4. Moving average convergence divergence
The moving average convergence divergence is regarded as an indicator that engages in detecting changes concerning the movement via comparisons about two moving averages. With this being the case, this type of indicator has the power to aid traders in the identification of opportunities for buying and selling around levels of support and resistance.
5, Bollinger bands
A Bollinger band is seen as an indicator that grants a range considering the trading norm of an asset’s price. The current volatility is indicated via the increasing and decreasing of the width of the bands. When the bands are closer to one another, this is perceived to indicate a lower volatility level. But the level of volatility is recognized as being higher when the bands are further apart.
6. Relative strength index
When traders desire to identify momentum, the relative strength index is a great option to use. This indicator is also used regarding market conditions and warning signals about price movements that are regarded as dangerous. The relative strength index is indicated via the use of numbers between zero to one hundred. When an asset has a rating of seventy, this is usually considered to be overbought. On the other hand, when it is noted that the asset tends to sit at a thirty rating, the asset is perceived as being oversold.
RSI indicator is one of the best momentum indicators for intraday trading as well as breakout strategies.
7. Fibonacci retracement
When you hear the term Fibonacci retracement, this refers to an indicator that has the power to be able to engage in the pinpointing of the degree that a particular market under surveillance will progress against its own recent trend. It is noted that a retracement is recognized as occurring in such instances that there is a dip in the market that is temporary. Further, this is also referred to as being a pullback. When traders believe that the market will soon move, they generally apply the Fibonacci retracement usage to gain confirmation if this is so. This is because this aids in identifying plausible rates of support and resistance, which could denote a trend that is upward or downward.
8. Ichimoku cloud
The Ichimoku cloud is categorized as being a rather technical indicator. This is based on the premise that this indicator engages in identifying levels of support and levels of resistance regarding the realm of trading. Yet, it is further realized that this indicator also engages in estimating the momentum of price points and grants traders a provision of signals to aid them in making decisions about their trades. It is interesting to realize that this indicator is a one look chart regarding equilibrium determination, which is what the name of this indicator means. This is why this indicator is implemented by many traders who need much information from the provision of one singular chart.
9. Standard deviation
Standard deviation is an indicator used to aid traders in measuring the size of the price points’ moves. This allows them to identify how plausible it is that the trade price will be impacted by volatility in the future.
Standard deviation is recognized for comparing recent price points’ movements in correlation to price points’ historical movements. Many traders perceive that large moves of price points occur after small moves of price points, and small moves of price points happen after big moves of price points.
10. Average directional index
The average directional index demonstrates the strength of a trend in pricing. It is based on a range of zero to one hundred where a rate of more than twenty-five is regarded as a trend with good strength. On the other side of the spectrum, a rate of under twenty-five is seen as a drift. This information is useful to traders to realize if a trend that is either downward or upward will probably continue to proceed.
11. Murrey levels
Murrey levels are levels created from Gann’s theory. In this strategy, the trader knows that some areas are better for the trend and some better for the breakout. You can download the free Murrey levels indicator and learn more here.
The best indicators for day trading case study results
654 traders answer this survey in the last 12 months. Results show that there is no proof that some indicator is better than others in trading habits. The most important indicator for intraday trading based on survey results is the RSI indicator with 17% of votes.
Discussion about indicators
You can combine sets of indicators on your price chart that contains two each to seek points of initiation and exit a trade. Take into consideration, for example, that you can combine RSI and the convergence and divergence of the moving average to provide the suggestion and the reinforcement about various signals for trading.
Conditions that have undergone the process of being overbought or being oversold can be suggested by using the relative strength index, which in abbreviated form is referred to as RSI. This can be achieved by conducting the measurement of the movement of the asset’s price. J. Welles Wilder Jr. is attributed as having created this indicator. He suggested that the momentum should achieve a level of 30 on a scale from 0 to 100. He stated that this is indicative of the overselling of an asset. This means that this presents a buying opportunity. He mentioned that a level of 70 percent is indicative of the overbuying of an asset, which means that this is also an opportunity for selling or even short selling.
With the application of Wilder’s levels, there can be a continued trend to an increased asset price for an extended period of time. In contrast, the RSI tends to indicate that the asset was overbought or oversold. Because of this reality, it is preferred to follow the RSI only in such cases that there is the conformity of its signal regarding the trend of the asset’s price.
Indicators do not predict market future prices. Indicators only remove noise in the time series data set, give the edge for traders, a better picture of the chart, important levels. Anyway, there are no rules – which indicator is the best or which intraday indicator settings are the best for trading. Each trader needs to stick to his/her strategy and enjoy trading as a passion and business.

He is an expert in financial niche, long-term trading, and weekly technical levels.
The primary field of Igor's research is the application of machine learning in algorithmic trading.
Education: Computer Engineering and Ph.D. in machine learning.
Igor regularly publishes trading-related videos on the Fxigor Youtube channel.
To contact Igor write on:
igor@forex.in.rs
