Table of Contents
The MACD indicator is one of the most used oscillators in trading. However, many traders struggle to find optimal settings for this indicator. We tried to make our case study.
The Best MACD Settings for Intraday Trading – Case Study Video recapitulation is presented below:


In this article, we developed one test, created one profitable intraday strategy, and then varied the values of the MACD settings parameters in several combinations.


But first, we wanted to see the best MACD settings for intraday trading.
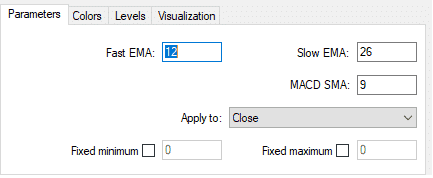
Standard MACD settings (12,26, 9) have the following parameters:
- (12) – ‘Fast line’ or the 12 periods EMA (exponentially weighted average)
- (26) – ‘Slow line’ or the 26 periods EMA
- (9) – ‘Signal line’ or the 9 periods E, MA
Moving average convergence/ divergence, or, more precisely, moving average convergence/divergence, is an indicator for trading, created by Gerald and used for various stock price technical analyses developed in the last period of the 1970s.
MACD has been designed to help reveal the trend duration, momentum, direction, and stock price strength. The oscillator or the MACD indicator is a three-time series collection calculated with data from historical prices; it is typically the price of closing. The three series are the divergence series, a difference between the average and signal series. The other two are the signal series and the average series.

To use the MACD indicator correctly, use the MACD two lines.
You can try the Trading Ideas platform for free signals based on MACD for forex and stocks.
The best MACD settings for intraday trading
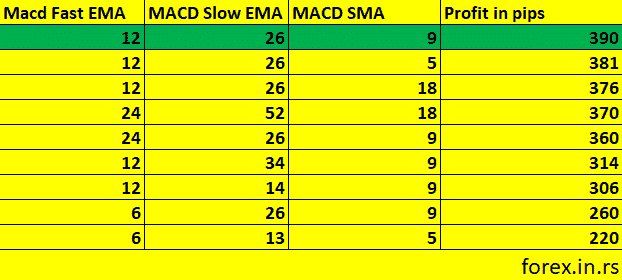
Based on forex.in.rs research on the M30 minute chart, default MACD parameters EMA 12, EMA 26, and EMA 9 are the best MACD settings for intraday trading. The study was done on 9 MACD settings. The best MACD settings for swing trading are default MACD parameters EMA 12, EMA 26, and Ewere MA 9.
Ma and settings for day trading were analyzed, and the setting for MACD was the difference between the 12- and 26-period EMAs. Our research tried combinations for greater MACD sensitivity and tested a shorter short-term moving average and a longer long-term moving average. MACD(6,35,6) is more sensitive than MACD(12,26,9) and can be a better MACD setting. When traders uM30 chart time frames in day trading, the best performance is obtained using standard r day trading (12,26,9).
Signal Line Crossover
The signal line crossover of MACD shows the change in direction addition, the changing. The average velocity of the MACD line when it crosses zero indicates that the direction is being changed. You can read a review about the Two-line MACD indicator for MT4 and make a free download on our page: Download MACD Indicator with Two Lines for MT4.
How is the MACD Indicator Used for intraday trading or long-term trading?
This indicates identifying moving averages and whether a new trend is bearish or bullish. The main goal of trading is to find a new trend, where one will find the most money and have a piece of the pie.
MACD Chart
The MACD charts show three different numbers being used for the settings. The first number is for the periods and is used to calculate the faster-moving average.
The second number of periods is used for the slower-moving average. Finally, the third calculates the number of bars, which differentiates the moving average between the slower and faster moving averages.
Basic MACD settings
As an example, if one were to come across the default setting of the MACD parameters that are 12, 26, and 9, these would be interpreted as:
Fast EMA period: The 12 previous bars represent 12 of the faster-moving average.
Slow EMA Period: The 26 previous bars are represented by 26 of the slower-moving averages.
Signal SMA period: The 9 previous bars are represented by 9.
Vertical lines would be plotted. However, there is a misconception between MACD lines and MACD lines. The 2 lines drawn do not reflect the price moving averages but rather the theming averages between the moving averages.
The original line would be smoothened when a slower-moving average is plotted. Further, this helps provide one with much more, and finally, the rate line. Finally, the histogram would plot the difference between the slow and fast-moving average.
The divergence is when one notices the two moving averages moving separately. The histogram will become more significant since the faster-moving average would move away or diverge from the getting average.
The histogram moves together as the moving average gets closer. This is called convergent closer or converges average would get closer or converge to the slower-moving age. This is the entire process of the Moving Average Convergence / Divergence.
Now that you have understood what MACD does, it is time to know what it can do for you.
MACD for Slow and Fast-Moving Averages
A new downtrend would be identified as the lines crossed under the slow line temporarily disappearing. This appears temporarily as the lines cross. It is due to the line difference when the cross is zero.
Furthermore, when the downtrend starts, the histogram gets more significant as the fast line diverges or moves away from the slow line. This is an indication of a definite trend. Let’s have a look at the examples.
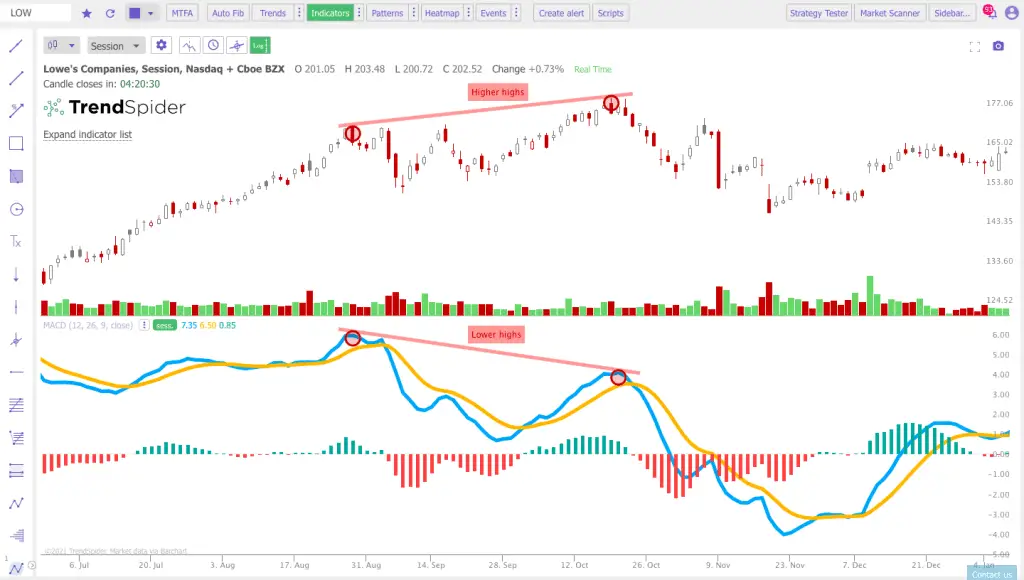
Let’s look at an example for a better understanding.
The Trendspider platform allows outings to be used outside of MetaTrader
You want to analyze charts using MACD, detect trends, and develop them, you can use the Trendspider platform.
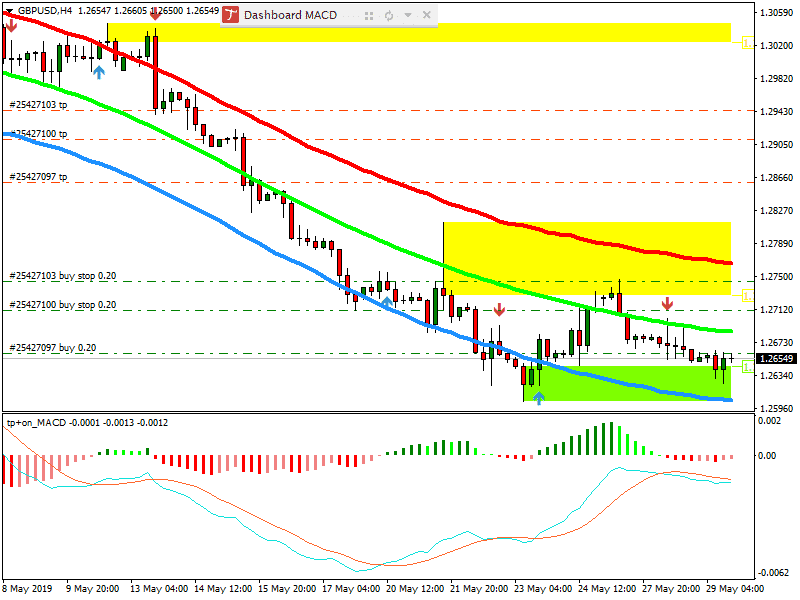
Our MACD intraday settings using Expert Advisor tests
Indicators :
1) MACD with several settings
2) Channel (we used our indicator, but you can use any channel indicator, for example, the Donchian channel).
3) Important level indicator. Our indicator is based on previous highs and lows, but you can use Pivot points or Fib levels.
Rules :
We created several combinations and created BUY and SELL rules on 30 30-minute charts:
BUY if we see a bullish MACD cross or zero line cross AND the price touches a significant level, AND the price is in a bullish channel. Stop loss is the last important level swing. Target at the next level.
SELL if we see a bearish MACD cross or zera vital, AND the price touches a critical level, AND the price is in a bearish channel. Stop loss is the last important level swing. Target at the next level.
In the first test, we used 30 30-minute chart and basic MACD settings. Then, we repeated several tests with different combinations :
Important fact:
You can combine the moving average strategy with MACD. The best moving average crossover for intraday (or long-term strategies) is a combination of SMA10, SMA50, SMA100, and SMA200, but you need to change the chart time frame for each strategy. For the long-term strategy, you will use a combination of SMA10, SMA50, SMA100, and SMA200 on H4 or a daily or weYoutrading; you will use m30 or m15 or a 1- for the intraday trading minute chart.
The best MACD settings for 5 minute chart
The best MACD settings for a 5-minute chart are parameters 24, 52, and 18. They showed 5% better performance than default settings 12,26,9.
The best MACD settings for 15 minute chart
The best MACD settings for a 15-minute chart are parameters 24, 52, and 18. However, in our case study, this setting is only a few percent better than the defaulting 12,26,9.
This setting is best for longer periods than the default settings for small time frames—for example, the best MACD settings are for higher periods than the default settings. Higher periods analyze more minutes and provide robust solutions to price volatility.
The best MACD settings for 30 minute chart
The best MACD settings for the 30-minute chart are default parameters 12, 26, and 9. However, we didn’t find statistical significance when comparing default settings and varied value combinations.
The best MACD settings for 1-hour chart
The best MACD settings for the 1 hour chart are parameters 24, 52, and 18, and default settings are 12, 26, and 9. Both settings showed similar results. However, we recommend standard settings for 1-hour chart trading.
Trade with the help of MACD
As there are 2 moving averages with different speeds, it would be quicker to react to the price movement for the faster one than the slower a new trend would discovered. It would be the last line to be the first to react and eventually cross to the slower line. When the fast line begins to diverge as the crossover starts, it will move away from the slower line, and a new trend will be indicated as being formed.
Crossover tense of MACD
MACD has a drawback: they tend to lag in price since it is just the historical price average. One would expect a bit of lag as the MACD represents the averages of others, and they are, as such, smoothed out by one another. Despite this, it is still one of the practical tools most traders use.
Indication of Changes in StocEMAs can indicate changes in stock trends k or Forex Trends.
The MACD indicates the changes that responded; usually, the fast EMA responds. The main stock trends can be revealed in the stock trends with the help of the divergence series.
MACD Mathematical Interpretation
The MACD is a measure filtered by the price, which derives the input regarding signal processing time. Velocity is the term for derivative as used in technical stock analysis. It would estimate the derivatives just like they had been calculated. The difference in the time constants would be discovered using filtering by the 2 low-pass filters.
Just as it would have been filtered by an EMA of a single low-pass exponential filter, MACD can be seen to approximate the derivative through calculation. The time constant would equal the sum of two filters’ time constants, which one would multiply by a similar gain. The MACD derivative would be estimated through the approximate filtering of the equivalent of an EMA filter of low pass.
Furthermore, the average series can also be considered a derivative estimate, for further smoothing would be done by the additional low-pass filter. The difference between the intermediate and MACD series would represent a second price measure connected to the time. The estimate would have an additional gain factor equal to the signal’s filter constant and additional lag.
Classification
MACD could be classified as an APO (absolute price oscillator) as it does not deal with percentage changes but with mA ovi, overages of the actual prices., PPO or a percentage price oscillator would compute the difference between 2 moving averages of the price dcalculatesnger moving average.
The PPO will calculate shows relative to price, lower prices, and minor low securities with higher prices. When comparing higher price securities. When one compares the oscillator values of various securities, a PPO would be preferred, especially for different prices.
The DPO (Detrended Price Oscillator), another member of the price oscillator family, ignores long-term trends. Instead, short-term patterns are emphasized.
EMAs highlight the current changes in stock prices. The MACD can gauge the changes in stock trends by comparing the different lengths of the EMAs. The difference between the average claimed by the MACD and the MACD series helps reveal the shifts in the direction and the strength of the stock trends. It might even be necessary to correlate the indicators of the MACD to signals such as the RSI power.
Some traders would attribute importance to the MACD line that crosses the 0 axes and the MACD line that crosses the signal line. The importance is also due to the disagreements between the different lines, the MACD line, and the stock price.
Signal-Line Crossover in our tests
It happens when the average lines and the MACD cross, meaning the divergence would change its sign. The interpretation of this would be that buying as long as the MACD line crosses the average line would be recommended. These events indicate a trend in which the stock would accelerate toward the crossover.
False Signals in our tests
It is possible for there to be false signals, just like any other forecasting algorithm. Therefore, applying filters to the signal line crossovers would be prudent. Analysts use different approaches to find the right results. We chose our trading rules. You can make any test using its strategy. Each strategy will have a way of achieving success.
We think the best way to achieve success is using standard basic MACD intraday settings because most “big dog” traders and institutions use these settings. Our test produced similar results, but basic settings produced the best results.

He is an expert in financial niche, long-term trading, and weekly technical levels.
The primary field of Igor's research is the application of machine learning in algorithmic trading.
Education: Computer Engineering and Ph.D. in machine learning.
Igor regularly publishes trading-related videos on the Fxigor Youtube channel.
To contact Igor write on:
igor@forex.in.rs
