Table of Contents
Knowledge and skills are a must for successful trading. Traders gain experience by trading in different situations in the market. However, the skills cannot guarantee success. Traders need the support of technical indicator analysis tools to understand market trends more clearly. These indicators help the traders to know how a market may perform soon.
Indicators can be classified into four categories: Volatility, Volume, Momentum, and Trend Indicators. All these indicators help determine the market situation in their relative field. For example, Trend Indicators are used to determine the strength and direction of the market trend, while Momentum Indicators help assess the strength of the price movement.


Many indicators fall under the above categories. This article will talk about two commonly used momentum indicators— Relative Strength Index (RSI) and Moving Average Convergence Divergence (MACD)- typically used to indicate the movement of price and its strength.


Many reports and leading investment companies ascertain that trading results through the RSI indicator were much more promising than the MACD indicator. This statement is widely based on the fact that RSI has proved more accurate while MACD has given mediocre results. However, this is not the case with every trading scenario. In certain situations, MACD can work better than RSI. To use the MACD indicator correctly, use the Macd 2 line indicator for MT4.
It all depends on the trading situation that determines which indicator is better. Before knowing which indicator is more efficient, we must understand how these technical indicators work.
RSI (Relative Strength Index) Indicator
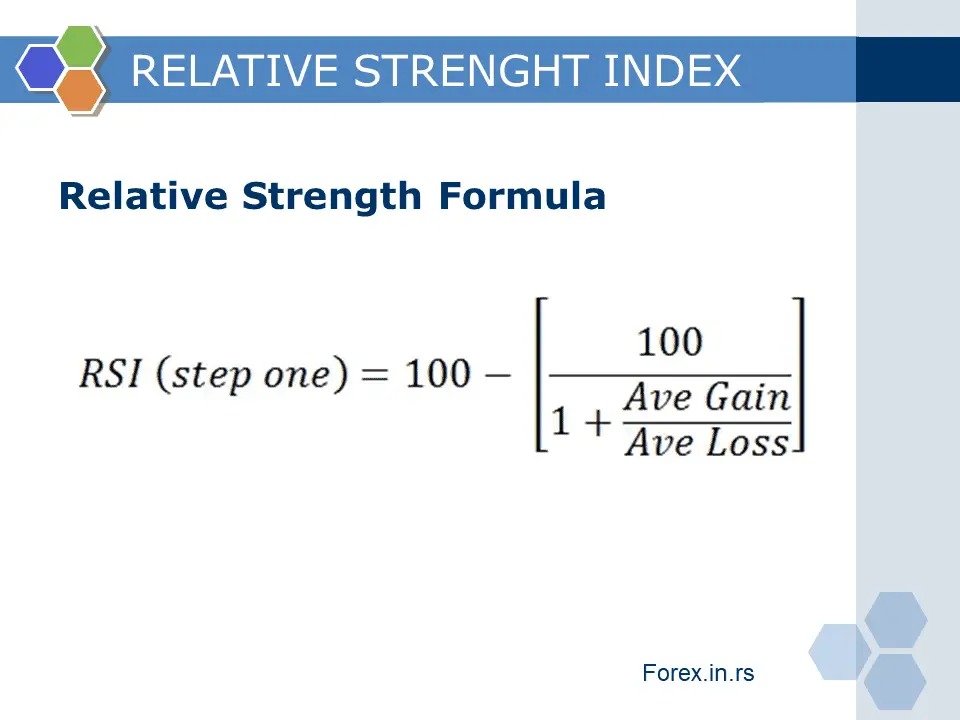
The RSI, or Relative Strength Index, is a momentum indicator used to determine the situations of over-sales and overbought in the trading market. This helps examine whether the current market condition is actual or not. It is typically displayed as an oscillator with a value on a scale of 0 to 100, which is more likely a percentage. If the value is above 70%, it reflects an asset’s overvalued or overbought condition in the market. If the RSI value is below 30%, it is the situation of undervalued or oversold assets in the market.

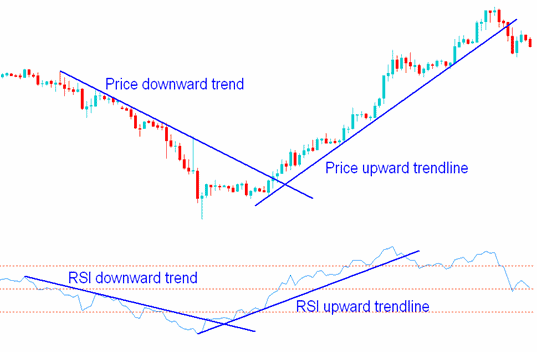
The divergence is another tool that has a greater significance for the RSI indicator. The divergence of the price action from the RSI signal indicates the possibility of a trend reversal. Many experienced traders have recommended this tool as efficient for identifying trend reversals. Due to its reliability, the indicator is widely popular.
Using the default setting of the RSI indicator, traders can plot the data from 14 trading periods. It is common among momentum indicators like MACD and RSI; the data is analyzed for the period depending upon the trading period used by the trader. The default setting of 14-day data is used for plotting daily chart trading. For the hourly chart, 14 hours of data is used by the indicator.
The default setting of the plotting data can be changed as per the trading period the trader is using. It is advisable when the market is more volatile. Traders use a shorter period; similar can be done using the MACD indicator. The shorter period is used because RSI will generate results based on the recent price trends. This will reduce the chances of false short-term signals, which are highly likely during a highly volatile market.
MACD (Moving Average Convergence Divergence) Indicator
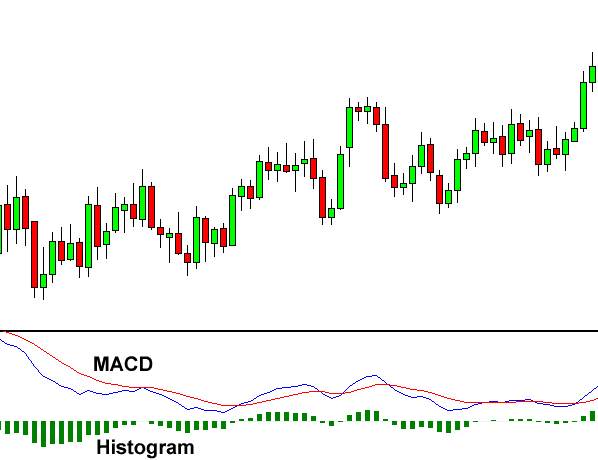
Moving Average Convergence Divergence or MACD is another technical momentum indicator used to estimate the difference between 2 EMA (Exponential Moving Average), typically 12-period EMA and 26-period EMA. It is a graphical representation of the MACD and signal lines with a histogram along the centreline. It represents the difference between short-term and long-term MACD, negative or positive.
To learn about the best MACD settings, visit our page.
The trading time frame determines the period of the MAs (Moving Averages). The 12-period and 26-period EMAs generate output when the daily chart is being traded. When using the MACD indicator, the 12-period EMA and 26-period EMA are the standard settings for generating the output. The chances of changing these settings are rare as they work efficiently well with almost all trading strategies. As per some reports published by leading institutions, the default settings of 12-period and 26-period EMAs are used by most traders while using the MACD indicator.
Since MACD is a momentum indicator, it compares the long-term and short-term price momentum and helps determine the current price’s momentum. Read the following facts about MACD to get more information about the indicator.
- The histograms below the centreline indicate negative MACD with downward momentum. In this situation, the short-term MA is less than the long-term MA.
- Histograms above the centreline represent a positive MACD. This indicates an upward momentum, where the short-term MA is greater than the long-term MA.
- If the trader is not using the default settings of the indicator, then it uses the 9-period EMA to create a MACD signal line. In non-default cases, it may also use smaller EMA periods.
- It is advisable to use shorter-period MAs in the case of highly volatile markets. You can change the indicator settings to get more recent trading signals.
MACD vs. RSI
RSI has a slightly better performance than MACD. Suppose we test major currency pairs where the entry position is generated by MACD or RSI and set 1 Daily ATR stop loss and 1 Daily ATR target price as an exit strategy. In that case, we can see that in 52% of cases, MACD is profitable, and in 52.8%, RSI is profitable. We didn’t calculate the spread in the test and used the last 20 years’ data.
MACD rule:
BUY: Buy if MACD lines make a crossover AND the price is above histogram, stop 1 Daily ATR, target 1 DailyATR
SELL: Sell if MACD lines make a crossover AND the price is below the histogram, stop 1 Daily ATR, target 1 DailyATR
RSI rule:
BUY: Buy if the RSI value is above 50, stop 1 Daily ATR, target 1 DailyATR
SELL: Sell if RSI is below 50, stop 1 Daily ATR, target 1 DailyATR
Both MACD and RSI are similar in many ways. For instance, they are both momentum indicators used to determine the power of the market trend. However, many advanced traders apply these indicators to their trading strategies differently. As there is evidence that RSI has performed better in generating results than the results generated by the MACD indicator, this is not the case in every scenario. However, the situation has also been otherwise in some instances.
So, when it comes to comparing the two momentum indicators to find out which is better, it all depends on the trading scenarios in which one performs better and generates more accurate results.
The following are examples of a few scenarios, some of which are backed by researchers, in which one of the above indicators performs better.
MACD and RSI strategy
MACD crossover and RSI above 60 represent BUY order, while MACD crossover and RSI below 40 represent SELL order. This strategy aims to define the solid bullish and bearish trend and avoid false signals. However, if we test on major forex pairs, there is no significant statistical evidence that the strategy will be profitable.
Another bad thing is not just the low winning ratio (almost 50%). Our strategy didn’t count for a considerable spread difference commission.
Summary: MACD and RSI Strategy
- MACD and RSI Strategy Overview:
- A MACD crossover with RSI above 60 indicates a BUY order.
- A MACD crossover with RSI below 40 signals a SELL order.
- The strategy aims to identify clear bullish and bearish trends while minimizing false signals.
- Testing on major forex pairs shows no significant evidence of profitability.
- The strategy suffers from a low win ratio (around 50%) and does not account for the impact of spread difference commissions.
Trading Scenarios Where MACD Outperforms
- Versatility and Adaptability:
- MACD provides better results across various market conditions and time frames.
- It allows for adjustment in divergence settings, though 12-period and 26-period EMAs are standard.
- Suitable for smoothing trading signals in volatile markets by using longer-moving averages.
- For short-term trades in volatile assets, smaller moving averages enhance signal accuracy.
- Efficiency in Trending Markets:
- More accurate in identifying trend lines for small-cap and large-cap securities.
- Not as effective in non-trending or sideways markets, where RSI performs better.
- Short-Selling Securities:
- Found to be more effective for short-selling, especially in Australian, Japanese, and American markets.
- Short-selling involves borrowing, selling, and then repurchasing shares for profit, a strategy well-supported by MACD but requiring high skill and knowledge.
Trading Scenarios Where RSI Performs Better
- Combination with Fundamental Analysis:
- When combined with Fundamental Analysis, RSI can significantly improve profitability.
- Alone, technical indicators like RSI don’t generate substantial returns; the integration with Fundamental Analysis enhances outcomes.
- Non-Trending Markets:
- RSI provides more reliable signals in non-trending markets compared to MACD.
- RSI can navigate the higher risk in these markets with more dependable signals.
- Accuracy and Frequency of Signals:
- While less frequent than MACD, RSI signals tend to be more accurate and profitable.
- Suitable for traders aiming for long-term profitability.
Trading Scenarios in Which MACD Performs Better
The following are some scenarios in which the Moving Average Convergence Divergence (MACD) performs better than the RSI indicator.
MACD Is More Adaptable As It Provides Better Results in Different Market Conditions and for All Time-Frames
The evidence of the versatility of the MACD indicator can be seen in the research paper “Technical analysis of Forex by MACD Indicator,” written by Ziba Habibi Lashkary in 2018. She wrote about the study conducted on MACD indicators in Forex Trading in her paper.
The study results stated that the MACD indicator could be applied in multiple conditions to generate more accurate results for both long-term and short-term periods. It also works efficiently on different time frames, like monthly, weekly, or daily. Also, it gives the indicators the privilege to adjust the divergence of the moving averages according to the security they prefer. Therefore, keeping it fixed to 12-period and 26-period EMAs is unnecessary. However, it works better in these two divergences, but that doesn’t mean it will work in every scenario.
For example, when it comes to trading on a highly volatile asset for the long term, a trader would benefit if the trading signals were smooth to reduce the chances of false signals. This can be done by using longer-moving averages with MACD settings. It will flatten the medium to short-term volatility of the MACD signal. It is like getting a clear indication of when to buy or sell securities with high volatility.
Also, smaller moving averages can be used in MACD indicators for short-term trade signals when a trader trades highly volatile assets. This helps generate trading signals derived from the most recent market trends. Therefore, there are fewer chances that outsiders will manipulate your trading signals.
More Accurate Signals When the Market Is Trending
The MACD indicator is more suitable for small-cap and large-cap securities. However, the results were unsatisfying for the mid-cap securities, where the trend lines emerged less organized.
If we look at statistical data from the same study, the accuracy of the trendline predicted by the MACD indicator for small-cap and large-cap companies was 80%. We mean companies with a market capitalization above $10 Billion by large-cap companies. Companies with a market capitalization value of less than $1 Billion are considered small-cap companies.
However, the same study shows that the MACD indicator failed to perform efficiently when the market was non-trending. When the market fails to take a particular trend, or in simple terms, the market is experiencing sideways movement; the indicator cannot form an accurate trendline. Therefore, as a result of the study, the MACD indicator is suitable when the market is trending and not fluctuating. In fluctuating markets, the RSI indicator tends to perform better.
MACD Works Best for Short-Selling Securities
Another study conducted in the Australian market by Business Perspective in 2014 showed that the MACD indicator is better for short-selling securities if we compare it to RSI, which is not entirely compatible with short-selling. Further, this finding was backed by other researchers who conducted similar tests in Japanese and American markets.
However, no matter how efficient an indicator is with a particular trading strategy, it is always advised to be sure about your skills and approach. Similar is the case with short-selling, considered one of the riskiest trading strategies. It requires skill and knowledge and is unsuitable for the average trader to try short-selling if they are not confident.
Typically, there are four stages of short selling in a stock market. It starts with borrowing the shares from an investment firm. Note that the shares are not purchased but borrowed by the trader. Then, these borrowed shares are sold to investors, and when the price is profitable for the trader, he repurchases the shares from the investors and earns profit from them. In the end, the trader returns the shares to the company from which he borrowed the shares.
This was a complicated process as so many purchases and repurchases were involved. At any step, things could have gone wrong. For example, if the price of the shares fell, traders would incur huge losses instead of going up as they eventually have to return the shares to the company as they were borrowed and not purchased. Therefore, he might have to buy back the shares even at a loss. This situation can get distinctively complicated, depending upon the traded securities.
However, for experienced traders, this can work well with the help of the MACD indicator.
Trading Scenarios in Which RSI Performs Better
Now that we know some situations where the MACD indicator works better, we will look at some scenarios, mostly the opposite of where MACD works better when RSI performs better and generates better trading signals.
Relative Strength Index and Fundamental Analysis
Sacred Heart University conducted a study in 2010 to analyze if technical analysis tools can help individual investors earn better profits from the stock market. The university examined RSI and other technical indicators, and the results declared that some of them and the RSI indicator could generate better results if combined with Fundamental Analysis.
RSI and MACD indicators are used for a similar purpose: to find the power of the change in the security price to determine buy and selling points. The above study could find a general rule for using the RSI indicator. However, the results were much more promising when the RSI was combined with Fundamental Analysis.
The study concluded that when used alone, the technical indicator could not generate any insightful returns. Instead, it was the Fundamental Analysis that helped in deriving profitable results from it.
More Accurate Signals When the Market Is Non-Trending
Contrary to the MACD indicator, RSI gives more accurate trading signals when the market is not trending or following a particular trend. The same study by Business Perspective indicates that, compared to the MACD indicator, RSI is more reliable in a non-trending market. A non-trending market refers to a market situation when the market is not taking up a particular trend. Instead, it is more scattered or moving sideways. The movement is very regular between the support and resistance levels. This situation does not give rise to a trend continuation; the problem is abrupt.
Due to the abrupt market situation, there is no guarantee of what turn the market will take; hence, the risk is higher. However, as per the study, the RSI could generate reliable signals, allowing traders to trade in a high-risk market. MACD cannot expect such reliance in the non-trending market.
However, it doesn’t matter how reliable the studies may have shown a particular indicator; an indicator cannot be used alone to reach a trading decision. It must always be paired with fundamental analysis tools and technical analysis to support the signals generated by these indicators to make them more concrete. Therefore, even if you are using RSI, MA, CD, or both, make sure not to depend entirely on the signals they generate and include fundamental and technical tools in your trading strategy.
Results Generated by RSI Are More Accurate but Less Frequent
The study by Business Perspective, which indicated that MACD works better for short-selling, was conducted to determine the significance of both MACD and RSI indicators. It was executed in the Australian market, focusing on the comprehensive profitability achieved through the signals from the above two indicators.
The result showed that RSI generated profitable trading signals frequently, but those frequent results were accurate. The capital invested increased with every trade, but RSI and not MACD were able to generate better results. Therefore, the overall outcome is that RSI was better than MACD.
Although it was frequent, whenever the RSI indicator created signals indicating the appropriate time to buy and sell a security, the result of the trade was profitable. Therefore, if a trader is looking forward to making a profit in the long term, RSI is the better momentum indicator.
Summary
The two types of momentum indicators, Moving Average Convergence Divergence (MACD) and Relative Strength Index (RSI), are used for the same purpose to determine the strength of a market trend. The trading signals from these indicators can be used in the trading strategy of many assets or different markets. The markets that widely operate these signals are cryptocurrencies, stocks, and Forex.
According to all the reports mentioned above, multiple studies were conducted to investigate how the two indicators perform in different market conditions. If we combine these results, then on average, both the indicators could perform optimally well in certain market conditions. However, their relative strength and reliability vary according to trading strategies and market conditions.
For example, MACD performed better in short-selling securities trending markets and is adaptable to almost every time frame and market condition. While RSI gave more accurate signals but was frequent, it performed better during the non-trending market and worked better with fundamental analysis.
However, it is a generally applied rule that your trading decision must not be based on a trading strategy that comprises only a single technical indicator. Instead, there should be multiple indicators and technical analysis tools that can support the signals of one another and form a solid foundation on which your trading decision can survive and generate profitable results. It doesn’t matter how good a technical indicator is; it cannot support your trading decision strongly without the help of other indicators.

He is an expert in financial niche, long-term trading, and weekly technical levels.
The primary field of Igor's research is the application of machine learning in algorithmic trading.
Education: Computer Engineering and Ph.D. in machine learning.
Igor regularly publishes trading-related videos on the Fxigor Youtube channel.
To contact Igor write on:
igor@forex.in.rs
Related posts:
- Download MACD 4C Indicator
- Download MACD 2 Line Indicator for MT4!
- Download MACD Divergence Indicator MT4!
- Best MACD Settings for Intraday Trading
- MACD and Bollinger Bands Strategy – BB MACD Tutorial
- Awesome Oscillator and MACD Strategy! – Awesome Oscillator vs. MACD
- Can You Use RSI and MACD Together?
- Download Heiken Ashi Smoothed Indicator – What is Heiken Ashi Trading Indicator?
- What is ADX indicator? – ADX Trading Strategy
- No Indicator Trading Strategy Still Working After 60 Years!
- Download Forex Bar Timer Indicator – Candle Time Indicator MT4
- Is RSI Leading or Lagging Indicator? – Everything About Relative Strength Index Indicator
