Table of Contents
Relative Strength Index – RSI
What is the Relative Strength Index?
Relative Strength Index or RSI represents a chart indicator that measures speed and change of price movement. RSI is an oscillator because its values oscillate between zero and 100. The asset is considered overbought when RSI values are above 70 and oversold when RSI values are below 30.


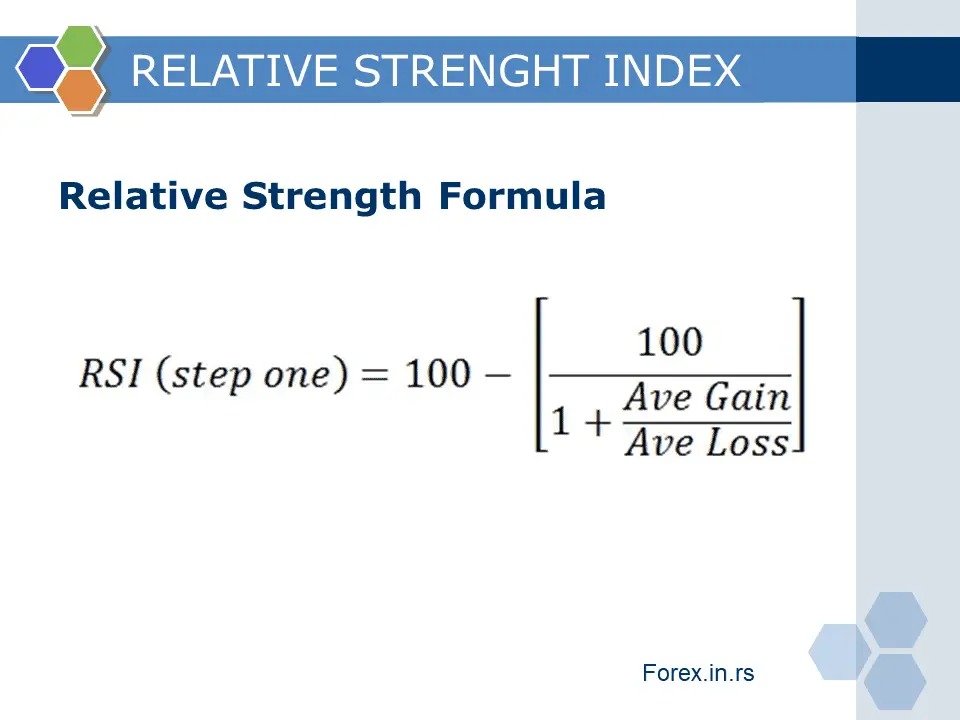
Short note on relative strength index: Relative strength index is a technical indicator that compares current and historical gains and losses to define if the asset’s value is overpriced or underpriced. The formula for calculating RSI is:


RSI = 100 – 100/(1 + RS*)
RS = Average of x days’ up closes / Average of x days’ down closes
The formula for the RSI indicator is below:
Understanding the Relative Strength Index
The primary role of this indicator is to remove noise in price movement representation. High relative strength index success rate we can see in application very often.
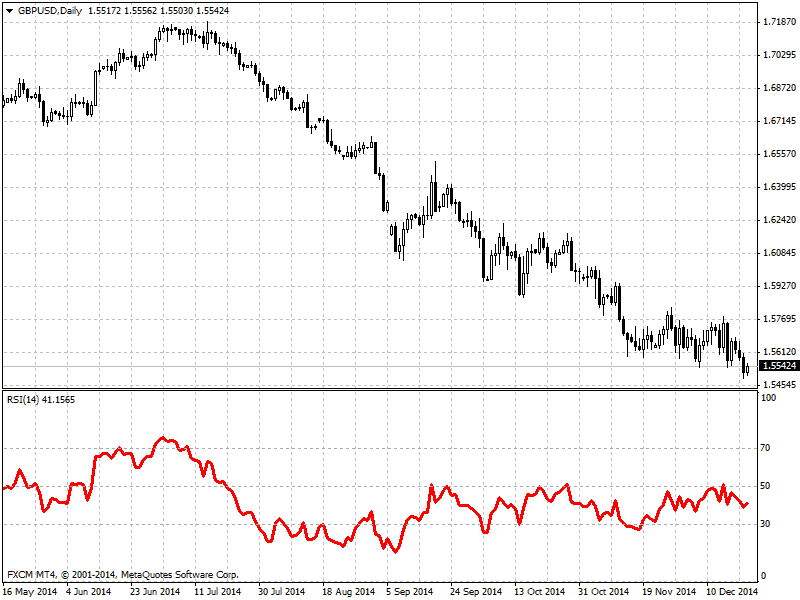
What is the Relative Strength Index in forex? In the forex, the Relative Strength Index or RSI is a momentum indicator that measures the magnitude of recent price changes, price strength, analyzes overbought or oversold conditions, price divergence.
Example of GBPUSD chart – RSI indicator is red:
How to read the Relative Strength Index
What does the relative strength index tell you? Interval in which RSI ranges from 0 to 100 shows if the asset is overvalued or undervalued (relative strength index law). As the RSI closes to level 70, the asset can be considered overvalued and has a significant chance of being overbought. On the other hand, when RSI reaches level 30, the asset is deemed to be oversold. The best way to use this index is to add additional information to other stock-picking tools because using only RSI traders can create false buy and sell signals, which can mislead the observer.
History of relative strength index
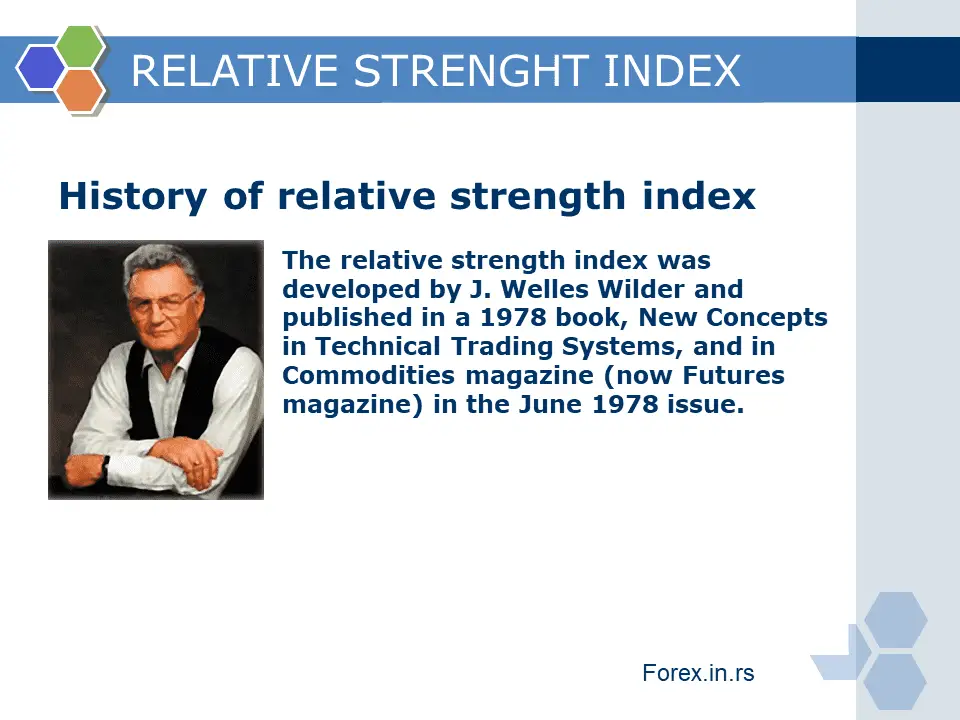
The relative strength index was developed by J. Welles Wilder and published in a 1978 book, New Concepts in Technical Trading Systems, and Commodities magazine (now Futures magazine) in the June 1978 issue. It has become one of the most popular oscillator indices. The RSI compares bullish and bearish price momentum plotted against the graph of an asset’s price. Wilder developed the Average True Range, the Relative Strength Index (RSI), the Average Directional Index, and the Parabolic SAR.
Relative strength index calculation example
How to calculate RSI in excel?
To calculate 14 days RSI in Excel, you need to form these columns:

- For example, “Column E” has all closing prices.
- “Column F” calculates the change in price by subtracting the current row from the previous row.
- If the “Column F” value is greater than zero, the value will be copied to Column G. If the value is less than zero, the value will be copied to “Column H.”
- “Column I” calculates the average Gain over the specified period, for example, 14.
- “Column J” calculates the average Losses over the specified period, for example, 14.
- “Column K” calculates the value of Relative Strength (RS).
- “Column L” calculates the value of the Relative Strength Index(RSI).
Please visit the website and download the relative strength index in the excel tool: Download the relative strength index formula excels.
How can we trade using this RSI indicator – advantages of using relative strength index?
How to use the relative strength index? First, we can use RSI directly to define overbought and oversold price levels, trend strength, and draw trendlines and analyze trends. Then, at last, we can use RSI to analyze divergence.
How does the relative strength index work? We can use RSI to determine overbought and oversold moments in trading. Below 30 is oversold, and above 70 is overbought. There are some rules for traders :
– The market can be oversold or overbought for a very long time. Therefore, it is not smart to trade orders above 70 and buy orders below 30 without deep analysis.
– Do not buy in the oversold market or sell in the overbought market without some confirmation in your direction (for example, some big move, bullish solid or bearish candle, etc.)
– The best strategy is – buy or sell after a pullback and respect the primary trend. For example, if the trend is bullish on a daily or H4 chart, the price is above 50 RSI in the strong bullish direction you can buy if the price goes in the oversold area on 5 minute or 30 minutes chart. See images below :
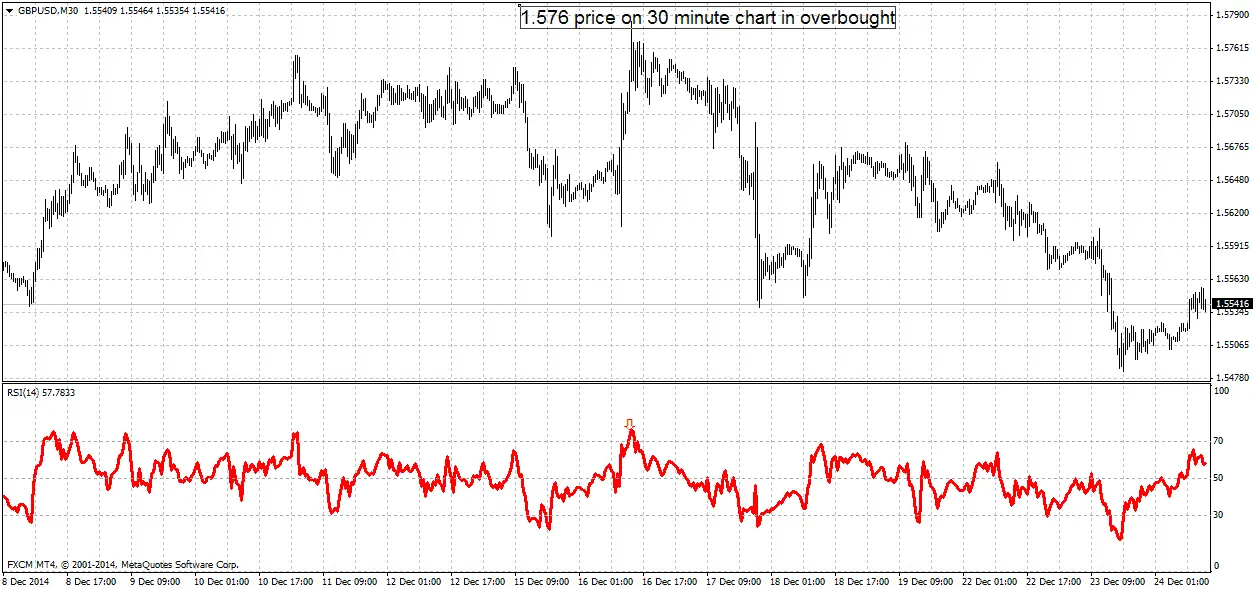
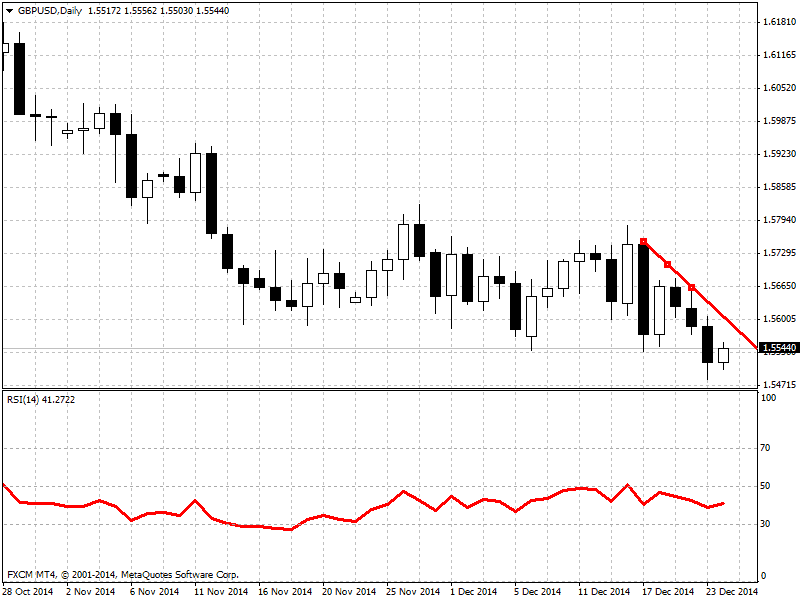
On the daily chart, we see a bearish trend. Next seven days price will fall 300 pips down :
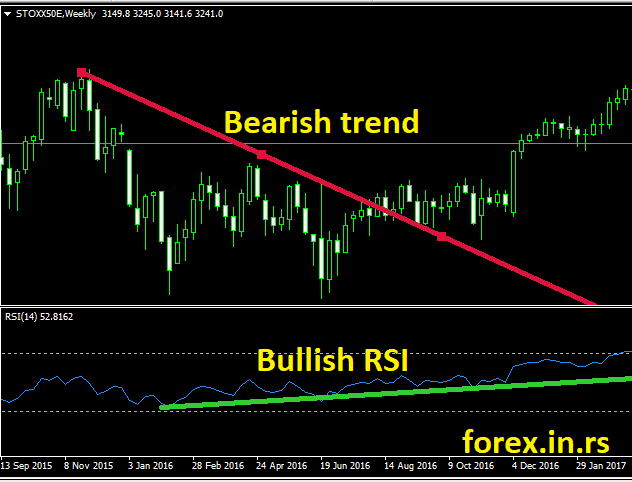
2) We can use the RSI indicator to find divergence and predict the change of the trend. For example, on the image below, we can see relative strength index bullish divergence (relative strength index when to buy) :
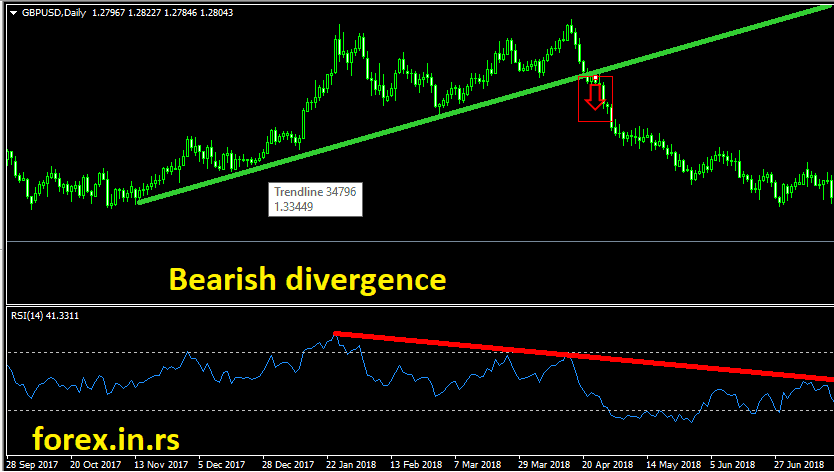
On this image below, we have relative strength index bearish divergence (relative strength index weakness) example:
Using RSI trend lines, we can avoid false breakout in trading or Market Has Hit an Extreme. How vital are levels 30 and 70 (relative strength index Bloomberg example), we can see in lovely highest RSI table? In this article, we can see the opinion “Many technical traders view anything above 70 as a sign that the dollar is overbought and due for a correction.”
3) My favorite way to use RSI – draw trend lines on the RSI chart and use it for trading!
Traders can draw trend lines below and above the RSI line. Trading RSI trend lines are the most productive way to use the RSI indicator. If the price breaks the trendline, then the trend will change. See example :
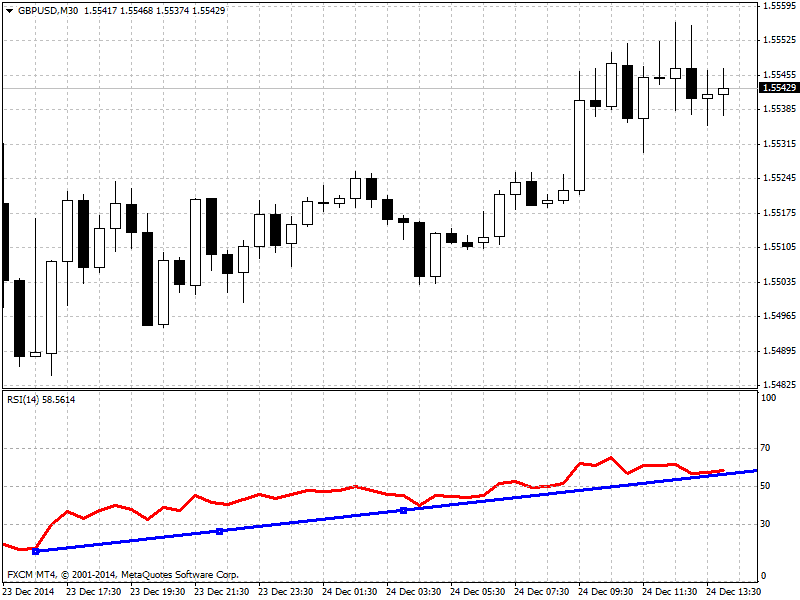
This example shows a bullish trend on 30 min chart. I can make buy orders above the trendline, but if the price breaks the RSI trendline, then the direction is changed. Of course, on the 30-minute chart, we can see 25% from ATR bearish trend in price breaks this line (around 20 pips) if price breaks daily trendline RSI that can give a few hundred pips profit.
Questions and answers from email messages:
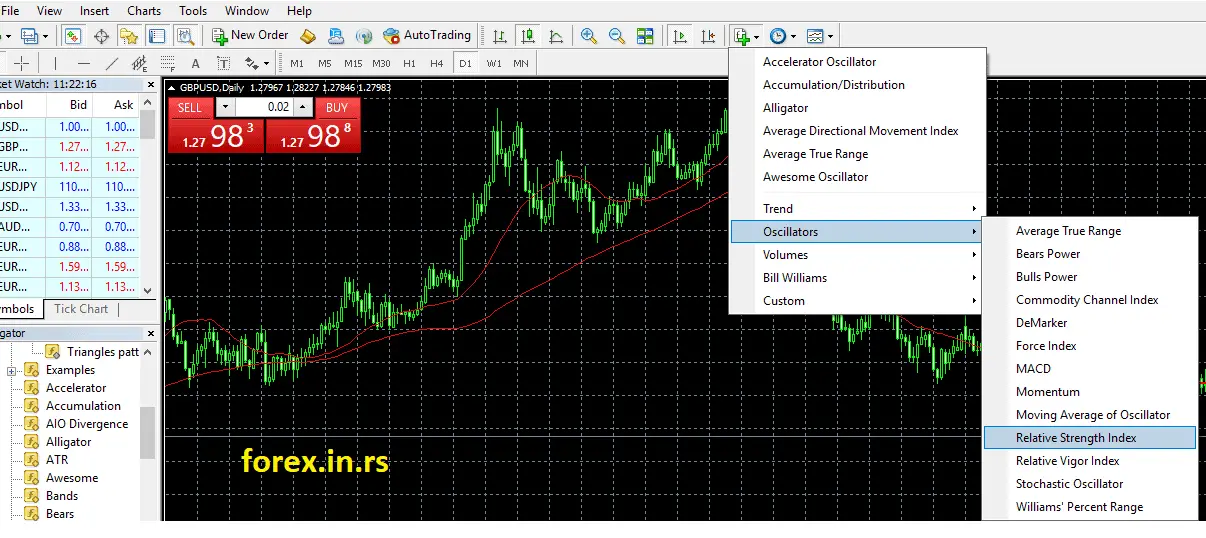
1) How to find a relative strength index indicator in Metatrader?
RSI is a significant indicator. It is in the indicator section in group oscillators.
2. What is an excellent relative strength index number
Each number in RSI is “good.” It is just a strength index. For example, if the price is above 70 or below 30, it can be an excellent trend to profit in the future. Price around 50 can be in a range market, but it can be a substantial trend decline or rise if we have a substantial divergence at that moment.
3. Should I set RSI settings differently? For example, is it better to RSI 8 or 14, RSI 7 vs. RSI 14?
My advice is to use default settings. All major world traders use (mostly) the same settings to make the decision based on default parameters. Summary, default settings are relative strength index best settings.
4. What are the relative strength index disadvantages and the advantages of using the relative strength index?
The most significant advantage is simplicity, easy reading, and relative strength index works in the chapter. However, one of the most important disadvantages is that RSI is a very fast indicator, and sometimes we need to wait for a higher time frame price closed conformation.

He is an expert in financial niche, long-term trading, and weekly technical levels.
The primary field of Igor's research is the application of machine learning in algorithmic trading.
Education: Computer Engineering and Ph.D. in machine learning.
Igor regularly publishes trading-related videos on the Fxigor Youtube channel.
To contact Igor write on:
igor@forex.in.rs
Related posts:
- Stochastic Oscillator vs. Relative Strength Index (RSI)
- Download RMI Indicator – Relative Momentum Index Formula
- Free Download True Strength Index TSI Indicator
- Is RSI Leading or Lagging Indicator? – Everything About Relative Strength Index Indicator
- What is Commodity Channel Index Indicator?
- How Does Stochastic RSI Work? – Stochastic RSI Calculation
- What is The Money Flow Index MFI indicator?
- Download RSI Divergence Indicator for MT4
- Choppiness Index Indicator For MT4 Download Free!
- Traders Dynamic Index Indicator – Download TDI Indicator
- Schaff Trend Cycle Trading System – Cycle Indicator MT4 Download
- Average Directional Movement Index Indicator
