Table of Contents
One of the most ancient and reliable techniques used in technical analysis is the study of candlestick patterns. Originating in Japan in the 18th century for the rice trade, candlestick charting has proven its merit in various financial markets across the globe.
I created one case study to compare in one Table reversal candlestick patterns.


What are the candlestick patterns?
Candlestick patterns represent trading patterns that use Japanese candlesticks, a financial chart that describes a security, derivative, or currency’s price movements using low, high, close, and open for some time (5 minutes, H1, H4, daily, etc.). Bearish and bullish patterns mean that some patterns indicate a future rising trend, bullish, or future downtrend.


When it comes to trading on forex, it is noted that traders use three primary methods on forex to generate signals for purchasing or selling, which depend on the trading strategies that the traders apply. First, they use forex chart patterns, forex indicators, and candlestick patterns, such as various reversal candlestick patterns. Therefore, this article will concentrate primarily on reverse candlestick patterns.
What is a reversal pattern?
The reversal patterns are chart patterns or candlestick patterns that announce a change in trend. Unlike continuation patterns, reversal patterns indicate the ending of an ongoing trend and represent moments for traders entering a position.
Key features of reversal candlestick patterns include:
- Clear Visualization: Each candlestick pattern provides a visual representation of the open, high, low, and close prices of a security for a specific period. The anatomy of the candlestick – its body and wick (or shadow) – reveals the tug-of-war between buyers and sellers.
- Predictive Nature: While no tool or pattern can guarantee future price movements, reversal candlestick patterns have a history of indicating a forthcoming change in sentiment. For instance, patterns like the Hammer or the Engulfing pattern can be harbingers of a reversal.
- Flexibility: These patterns can be observed across various time frames – from minutes to days to weeks. This makes them adaptable for both short-term day traders and long-term investors.
- Complementary Use: While powerful, reversal candlestick patterns become even more potent when used with other technical analysis tools, such as trendlines, moving averages, or indicators like RSI and MACD.
The ones presented here have the highest presence on the charts of forex. It is also interesting to realize that they are simple to detect when you comprehend what is needed to search for.

Consequently, it is realized that there are two kinds of reversal candlestick patterns – bullish reversal patterns and bearish reversal patterns. Furthermore, there can be the usage of just one candlestick in the pattern, or there may be a pattern derived via applying two candlesticks or even more.
To see all candlestick reversal patterns listed, visit our article.
Bullish reversal patterns are:
- Bullish Abandoned Baby
- Bullish Engulfing
- Piercing Pattern
- Morning Star
- Bullish Harami
- Hammer
- Inverted Hammer
Bearish reversal patterns are:
- Bearish Abandoned Baby
- Bearish Engulfing,
- Bearish Harami
- Dark Cloud Cover
- Evening Star
- Shooting Star
It is wise to note that there is a significant distinction between chart patterns and candlestick patterns. First, there is the application of geometry shapes regarding chart patterns, where candlesticks may be involved in the hundreds or well into the thousands based on the period. Then, on the other side of the spectrum, there is the consecutive formation of candlesticks as singles or in the amount of two or three, usually regarding the candlestick pattern.
High probability reversal candlestick patterns and the most reliable candlestick patterns in technical analysis are:
- Engulfing Reversal Candlestick Pattern
- Pin Bar Reversal Candlestick Pattern
- Harami Reversal Candlestick Pattern
- Doji Reversal Candlestick Pattern
- Railway tracks Reversal Candlestick Pattern
- Hanging Man Reversal Candlestick Pattern
Candlestick engulfing patterns
Bullish engulfing pattern
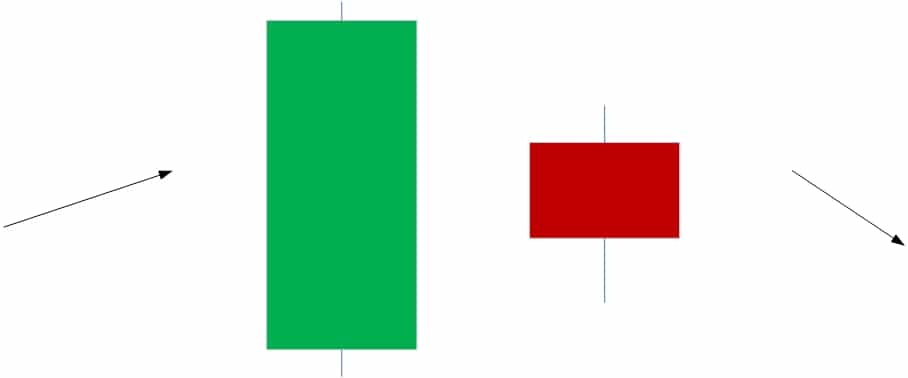
In terms of a candlestick pattern that is bullish engulfing, it is noted that this is in direct opposition to the candlestick pattern that is bearish engulfing. In such cases, this pattern is formed within a downward trend of the support sector; then, this trend could be switched over to a movement in the upward direction.
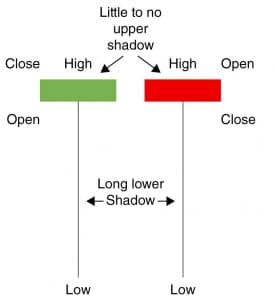
A bullish engulfing pattern represents one bearish and one bullish candlestick pattern where a bullish candle fully engulfs the smaller bearish candle, such as a bullish candle low is lower than a bearish candle low, and a bullish candle close is higher than a bearish candle close.
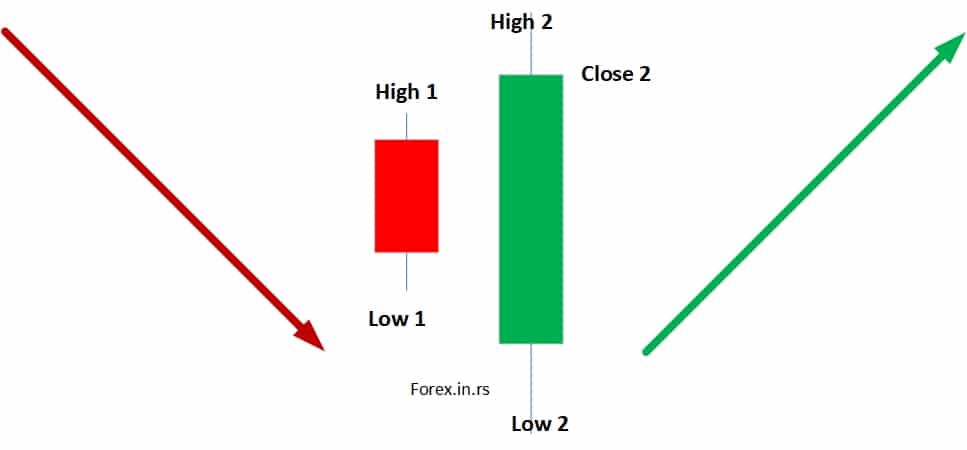
This type of pattern is recognized for applying the usage of two candlesticks. The first candlestick application is noted as being bearish, while the application of the second candlestick is considered bullish. Thus, there is a total engulfment of the first candlestick by the second candlestick that is bullish. This means that the lows and the highs are noted as exceeding those that belong to the first candlestick. In such instances, you notice the formation of this pattern when there is a downward trend; if the price reaches the support sector, it is time to engage in buying.
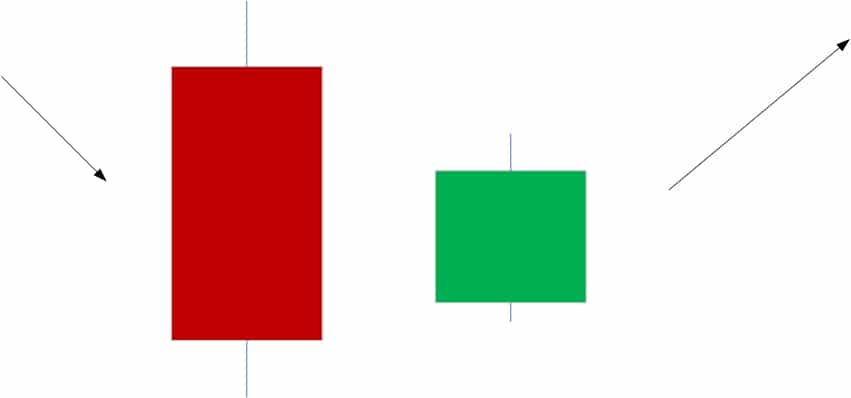
Bearish engulfing pattern
The candlestick pattern that is bearish engulfing is a pattern that engages in the application of two candlesticks. It is noted that the application of the first candlestick is determined to be bullish. However, the second candlestick application is determined to be bearish, demonstrating an ultimate change in the market’s sentiment. Therefore, it is vital to consider that the second candlestick’s application conducts the first candlestick’s total engulfment.
A bearish engulfing pattern represents one bullish and one bearish candlestick pattern where a bearish candle fully engulfs the smaller bullish candle, such as a bearish candle high is higher than a bullish candle high and a bearish candle close is lower than a bullish candle close.
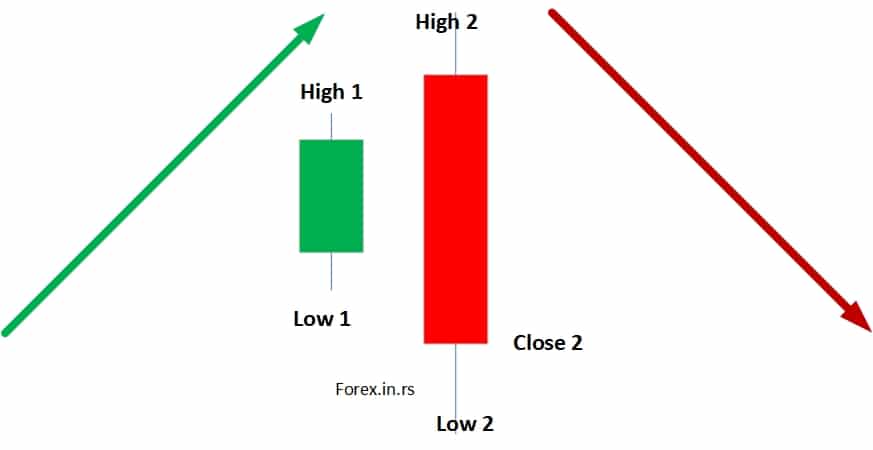
This means that the second candlestick overshadows the first candlestick. In such an instance, you notice this type of candlestick pattern gains a formation at the level of resistance or where you have perceived a downward trend line; then, it is time to engage in selling.
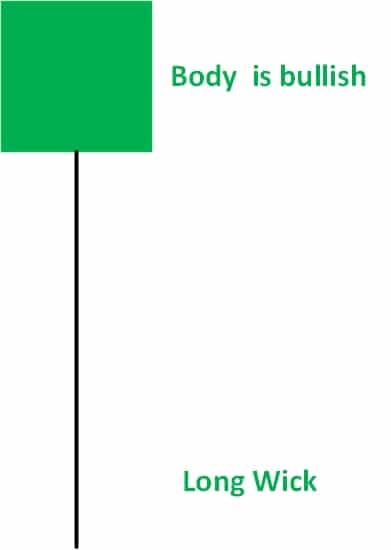
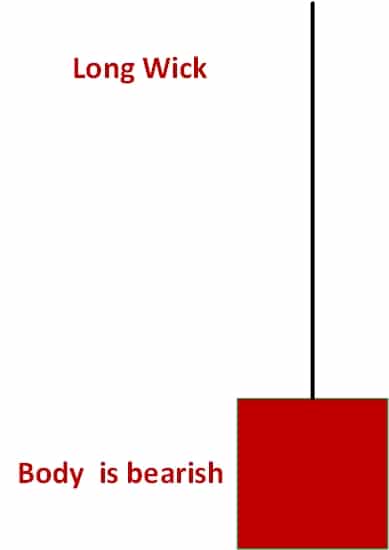
Pin bar Reversal candlestick patterns
When you hear the term shooting star, this refers to the bearish pin bar. This is due to the shape. It is further noted that this pattern applies to the usage of one candle. The distinctive feature of this type of candlestick is indicated as the tail exceeding long and the concise body. In such a case that you notice a pin bar that is bearish and gains a formation at the level of resistance, or when you perceive trend lines that are downward, or when you notice levels that indicate fib retracements that are downward, then it is time for you to engage in selling.
A bullish pin bar is one candle pattern with a longer down the wick and represents a sharp reversal or rejection of price and usually indicates a future rising trend. The image below is an example of a bullish pin bar reversal candlestick:
A bearish pin bar is one candle pattern with a long upper wick representing a sharp reversal or rejection of price and usually indicates a future downtrend. The image below is an example of a bearish pin bar reversal candlestick:
Harami Reversal Candlestick Pattern
Bullish harami candlestick pattern
Bullish harami represents two candles pattern, where the first candle is a significant bearish candle, and the second is a small bullish candle and usually indicates a future rising trend.
It is noted that a candlestick pattern that is bullish harami applies the usage of two candlesticks. The first candlestick application is bearish, whereas the second is bullish. However, the reality is that the second candlestick’s length tends to be short and is overcast somewhat by the shadow of the first candlestick, which is bearish. Therefore, when you notice the formation of such a pattern within the support sectors when the price reaches them, it is time for you to buy.
Bearish harami candlestick pattern
Bearish harami represents two candles pattern, where the first candle is a significant bullish candle, and the second is a small bearish candle and usually indicates a future downtrend.
When it comes to the candlestick pattern that is harami bearish, this equates to the bearish bar pattern inside. Moreover, this candlestick pattern applies the usage of two candlesticks. The first candle application is categorized as bullish, while it is noted that the application of the second candle is considered bearish. This is because the first candle overshadows the second candle. When you note a prior sector of support that then behaves like a level of resistance, and in such cases, the price increases to this level, a candlestick pattern is formed that is bearish harami. Then, at a later time, the price drops again. If you perceive the shape of a candlestick pattern that is harami bearish within the level of resistance, at the level of fib retracement, or a trend line that is downward, then you need to engage in selling.
Doji Reversal Candlestick Pattern
Bullish Doji reversal candlestick pattern
A bullish Doji reversal candlestick pattern is when a bearish trend is shifted into a bullish trend after a Doji candle (a Doji candle is a candle when a market’s open price and close price are almost the same).
Bearish Doji reversal candlestick pattern
A bearish Doji reversal candlestick pattern is when a bullish trend is shifted into a bearish trend after a Doji candle (a Doji candle is a candle when a market’s open price and close price are almost the same).
It is the tendency for candlesticks that are classified as being doji to be regarded as being neutral. However, some may hold a diverse perception. In such cases, when candlesticks that are Doji engage information during an uptrend presence within levels of resistance, some view these as probable reversal indicators that are bearish. Then, they trade the breakout concerning the low side regarding the doji candlestick pattern. There are a few distinctive kinds of candlesticks that are doji. The candlestick pattern that is doji applies the usage of one candlestick. The key feature is that it is ultra-short and possesses almost nobody. Therefore, traders can start selling when you view the formation of candlestick patterns that are doji within the resistance sectors.
Railway tracks Reversal Candlestick Pattern
Bullish Railway Tracks Reversal Candlestick Pattern
Bullish railway tracks’ reversal candlestick pattern represents two candle patterns: the first bearish and the second bullish candle, which are almost the same lengths and resemble parallel railway tracks.
Bearish Railway tracks Reversal Candlestick Pattern.
Bearish railway tracks’ reversal candlestick pattern represents two candle patterns, the first bullish and the second bearish candle, which are almost the same lengths and resemble parallel railway tracks.
When there is the usage of the pattern of bearish railway tracks, this indicates two candlesticks. The first candlestick application is bullish, while the second is bearish. Each candlestick must own a nearly identical length. As well, the bodies of each candlestick need to be similar.
Hanging Man Reversal Candlestick Pattern
Hanging Man Reversal Candlestick Pattern is a bearish reversal candlestick chart pattern at the top of an uptrend. A long wick candle represents it after a bullish trend.
A candlestick pattern applies only to one candle when considering the hanging man’s pattern. It should produce a formation in such cases that there is the experience of an upward trend within the sectors of resistance. When you notice this pattern in such cases, it is time for you to engage in selling.
Accuracy of candlestick patterns – Case Study
In this case study, our primary goal was to test the accuracy of Expert Advisor’s trades strategy based on high probability reversal candlestick patterns.
The tested period is from 1. November.2010. till 1. November 2020.
Currency pairs: EURUSD, GBPUSD, USDJPY, AUDUSD, NZDUSD, USDCAD.
Buy rules:
Create a Buy order when the bullish reversal pattern is detected, and the hourly candle is closed.
Stop-loss is a reversal of the lowest low in the last several hours.
The target is calculated, so the risk-reward is 1:1.
Sell rules:
Create a Sell order when the bearish reversal pattern is detected, and the hourly candle is closed.
Stop-loss is a reversal of the highest high in the last several hours.
The target is calculated, so the risk-reward is 1:1.
Reversal pattern case study results are presented in the table below:
| Pattern | H1 | H4 | Daily |
|---|---|---|---|
| Engulfing Reversal Candlestick Pattern | 51.1 | 52.8 | 53.4 |
| Pin Bar Reversal Candlestick Pattern | 49.6 | 50.1 | 52.4 |
| Harami Reversal Candlestick Pattern | 48.6 | 49.7 | 48 |
| Doji Reversal Candlestick Pattern | 50.3 | 49.8 | 50.4 |
| Railway tracks Reversal Candlestick Pattern | 49.6 | 50.1 | 49 |
| Hanging man Reversal Candlestick Pattern | 48.2 | 50 | 51.2 |
In this case study, we presented the most critical candlestick patterns that traders usually use as triggers. In addition, we used a USD basket of currency pairs that traders typically use in trading. The risk-reward was 1:1, so results at the research end were around 50% (about 50% of trades were profitable).
The table is presented as result percentages (around 50%) for each time Expert advisors were tested (H1, H4, and daily). Thus, results demonstrate the average number of all positive trades after testing and winning rate.
Engulfing bullish and bearish patterns and pin bar patterns have the best winning rate compared to other patterns. Higher timeframes (H4 and daily) perform slightly better than the H1 chart time frame.
Engulfing bullish and engulfing bearish patterns are the most reliable candlestick patterns for traders, but as we can see, the winning rate is not as high as many traders expect. Using optimization techniques and adding more filters, such as additional indicators or different time sessions, can be improved.
Analysis of the Case Study on High Probability Reversal Candlestick Patterns
- Overall Success Rate: The success rate hovers around 50%, roughly equivalent to flipping a coin. This indicates that using these patterns alone, without considering other factors, might not give a significant trading edge.
- Best Performing Patterns:
- Engulfing Reversal Candlestick Pattern: This pattern has consistently shown the highest winning rate across all the timeframes (H1, H4, and Daily), with its peak performance on the daily chart at 53.4%.
- Pin Bar Reversal Candlestick Pattern: The Pin Bar is second best, particularly on the daily timeframe, performing at 52.4%.
- Least Performing Patterns:
- Harami Reversal Candlestick Pattern: This pattern, especially on the daily chart, has a slightly below-average success rate of 48%.
- Railway tracks Reversal Candlestick Pattern: The performance of this pattern is below average on H1 and Daily, although it performs at an average rate on H4.
- Hanging Man Reversal Candlestick Pattern: While its performance on the daily chart is above 50%, its performance on H1 is the lowest of all patterns at 48.2%.
- Influence of Timeframes:
- Overall, the H4 and daily timeframes provide slightly better outcomes than the H1 timeframe. This might be because higher timeframes filter out much of the ‘noise’ seen on lower timeframes, making the patterns more reliable.
Conclusion
While specific patterns like the Engulfing and Pin Bar show a higher success rate, especially on longer timeframes, the results are still near the 50% mark. This suggests that traders should use additional confirmation tools, techniques, or methods alongside these patterns to enhance their probability of success. Relying solely on these patterns might not provide a substantial advantage. Risk management and proper position sizing are critical when trading in financial markets.

He is an expert in financial niche, long-term trading, and weekly technical levels.
The primary field of Igor's research is the application of machine learning in algorithmic trading.
Education: Computer Engineering and Ph.D. in machine learning.
Igor regularly publishes trading-related videos on the Fxigor Youtube channel.
To contact Igor write on:
igor@forex.in.rs
