Table of Contents
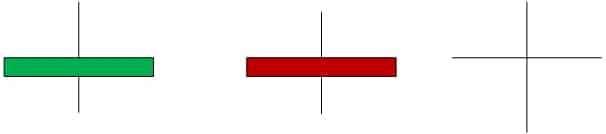
There are so many candlestick patterns, and it is easy for any trader to get confused. However, the Doji candlestick is known for its unique ‘cross’ shape, which is difficult to miss. This shape appears when a pair of currencies closes and opens at the same level. This leaves a small, and more often than not, a non-existent, body. You will see that the upper and the lower wicks are the same lengths. As we mentioned earlier, generally, the Doji pattern stands for indecision in the market. However, many traders use it to indicate an existing trend that is losing momentum.
What is a Doji candle?
The Doji candlestick pattern or Doji candle represents a reversal pattern candle where the open and close price levels have the same value or are approximately equal for the given period. Usually, the doji candle indicates a possible change in the trend or trend reversal.


One of the most robust doji candle patterns is the Double Doji pattern.


Doji forex strategy
Doji forex strategy is usually strategy based on the Daily chart Doji pattern. Usually, the doji pattern significantly impacts daily, weekly, and monthly charts when a breakout occurs.
The best strategy is to monitor several triggers when you create a trade. For example, change in Volume, important economic news, critical support, or resistance level touch can be excellent triggers with a Doji pattern combination.
Benefits of Using the Doji Star in Technical Analysis
The Doji candlestick pattern can be used to find the ‘pause and reflect’ price movement that can prove invaluable for traders. If the Doji pattern appears when the market starts to trend upward, traders can take this to indicate buying momentum is slowing down. On the contrary, it could also depict that the selling momentum is picking up. It can be viewed as the exit signal from a long trade.

Although traders are advised not to blindly move according to the selling indication and consider his previously set exit strategies and the coexistence of a technical indicator with the Doji pattern, this will help them to cross-check the reality with the indications of the market and be assured that what the market is offering would be beneficial to him as well. Cross-checking is essential because the market may show the trend for a limited period or be a flicker. Therefore, this careful analysis is helpful if the trader doesn’t want to lose his trade in a hush decision.
Types of Doji Patterns
Doji Candlestick Types are:
- Long-legged Doji
- Standard Doji
- Gravestone Doji
- Dragonfly Doji
- 4-Price Doji
Whenever there is indecision in the market, traders use the Doji candlestick pattern. However, it is essential to highlight that the Doji star pattern is often associated with this market. Four other variations of Doji have different ways to help the trader understand the market from different points of view and make decisions accordingly.
As discussed above, the Doji pattern alone cannot be trusted as an indicator. It must be accompanied by a strong and significant signal to correctly establish what it has been forecasting. Risk management is also a great way to avoid unexpected losses if things unfold differently from the predicted pattern.
Below are the different types of Doji patterns, their meanings, characteristics, and identifying them.
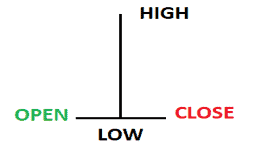
Doji Star
Doji star pattern has the same closing and opening prices, and the upper and lower wicks are all small and have the same length.
As we know by now, the Doji star or traditional Doji pattern represents indecision in the market. Therefore, it is out of the control of the seller and the buyer. There are often hints of a trend reversal. There is nothing new about the fact that while trading in this particular pattern, there is a need for a solid signal to support the trend predictions.
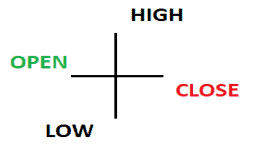
Long-legged Doji
The long-legged Doji pattern has the same closing and opening prices, and the upper and lower wicks are extended.
It is often associated with a market that has greater volatility. Like the Doji star pattern, it also shows indecision in the market.
The Long-Legged Doji commonly has a more significant expansion of the vertical lines beyond and beneath the horizontal line. By this, we can make out that the candle price movement energetically fluctuated at the time frame of the candle price movement but locked at nearly the similar level that it opened. This demonstrates the inability to make decisions between the seller and purchaser.
In the spot where The Long-Legged Doji appears, it is noticed that the rates are recalled just after an excellent downward move. Suppose Doji serves at the top of the retrieval (that we are unaware of while it is still developing). In that case, a dealer can now clarify their decision and possible changes in direction. And later on, looking forward to minimizing the combination of the upcoming candle next to Doji. For The Long-legged Doji, The stop loss will be spotted on the tip of the uppermost wick.
Dragonfly Doji
The Dragonfly Doji pattern is similar in shape to the letter “T,” where it has the same closing and opening prices, and the lower wick Is extended while the upper wick doesn’t exist.
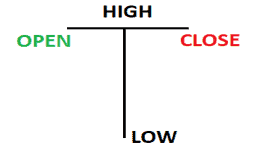
You will find this pattern tucked away at the bottom of a downtrend. It shows that lower prices have been rejected. It signals a bullish trend. It offers a change in the price direction.
A Dragonfly Doji resembles a ‘T’ shape. It signifies the upcoming change in the trend, primarily bullish. It strongly opposes the lower prices and can be seen at the bottom of a downtrend, hence, the bullish signal. The Dragonfly Doji can be seen at the elite of an upward move or the base of a downward movement and indicates the possibility of changes in a direction. No line will be observed beyond the horizontal bar, making a ‘T’ pattern and implying that rates never moved beyond the opening prices. An expanded, reduced wick on this Doji at the base of a bearish movement is a much more bullish indication.
Traders usually look for its formation at the resistance and support levels to trade with the Doji candlestick. In this case, the Dragonfly Doji can be seen at the trendline. This rejection of lower prices signifies that the trader can expect a bullish trend and prepare for a selling trend.
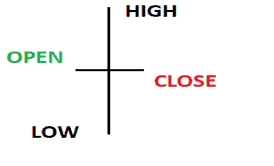
Gravestone Doji
The Gravestone Doji pattern has the same closing and opening prices, and the upper wick Is extended while the lower wick doesn’t exist.
This pattern is found at the top of an uptrend. It shows that higher prices have been rejected. It signals a bearish trend. It offers a change in the price direction as well. The Gravestone Doji and Dragonfly Doji are inversely proportional to each other. It occurs as the movement of rates starts and ends at the bottom end of the trade limit. Once the candle was opened, purchasers could push the rates upward but could not bear the bullish moment while closing. It indicates bearishness on the elite of an upward movement.
The 4 Price Doji
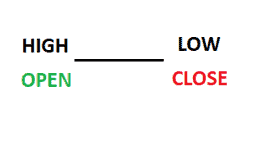
Four prices Doji pattern has the same closing and opening prices, and the wicks don’t exist.
The 4 Price Doji is just a horizontal line without any vertical line beyond or beneath the flat. The four-price Doji pattern represents the maximum inability to decide as all the rates, high, low, open, and close, showcased by the candle, are similar. The 4 Price Doji is an exclusive pattern representing an unstable and peaceful market.
It comprises only horizontal lines. There is the same level for all the highs and lows and the opening and closing prices. This is a unique pattern that shows indecision and low volatility. This pattern is rarer than the rest as it shows the ultimate uncertainty in the market.
Further Knowledge of Trading with Candlesticks
Reading a candlestick chart is crucial to strengthen before analyzing more confusing skills such as Doji candlesticks.
Factors to be counted while reading candlestick charts:
- Price action
- The time frames of trading
- Classic price patterns
The study of various types of Doji will be helpful to dealers by letting them utilize this primary data when they are trading with Doji candlesticks.
Conclusion
Different types of Doji indicators highlight various aspects of the market. Some represent indecision in the market, while others help traders to identify ongoing trends. Including these patterns in your trading strategy will prove to be beneficial. However, if you are new to it, use one of these patterns at a time.

He is an expert in financial niche, long-term trading, and weekly technical levels.
The primary field of Igor's research is the application of machine learning in algorithmic trading.
Education: Computer Engineering and Ph.D. in machine learning.
Igor regularly publishes trading-related videos on the Fxigor Youtube channel.
To contact Igor write on:
igor@forex.in.rs
