Table of Contents
The Engulfing pattern is a key concept in technical analysis used to identify potential reversals in a price trend. It involves two candlesticks and can signal either a bullish or bearish reversal, depending on the current market trend and the formation of the pattern.
Please see my video with a full explanation about Engulfing pattern trading:


The Engulfing Candle Day-Trading Strategy
What is the definition of engulfing?
Engulf is a verb that means being “surrounded.” In our case, we will talk about candle patterns.
What is the Engulfing pattern in trading?
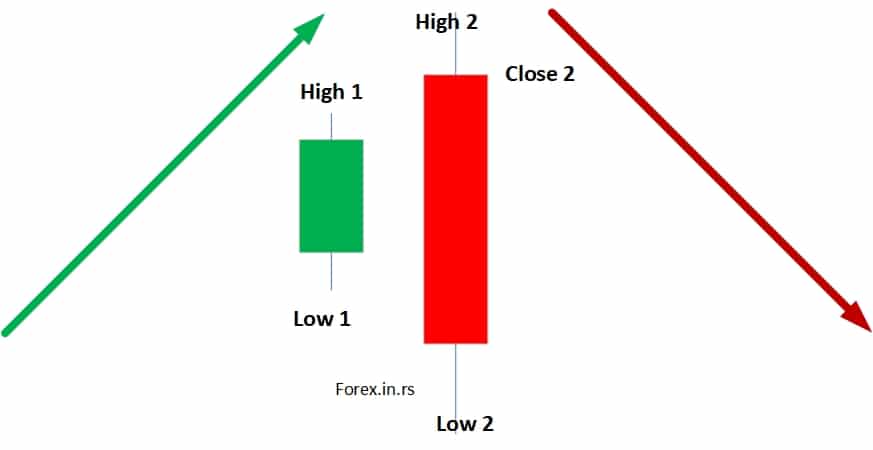
Bullish engulfing pattern definition: The Bullish Engulfing Candlestick Pattern is considered a bullish reversal pattern during a downtrend and occurs when the bullish candle engulfs the smaller bearish candle the period before.
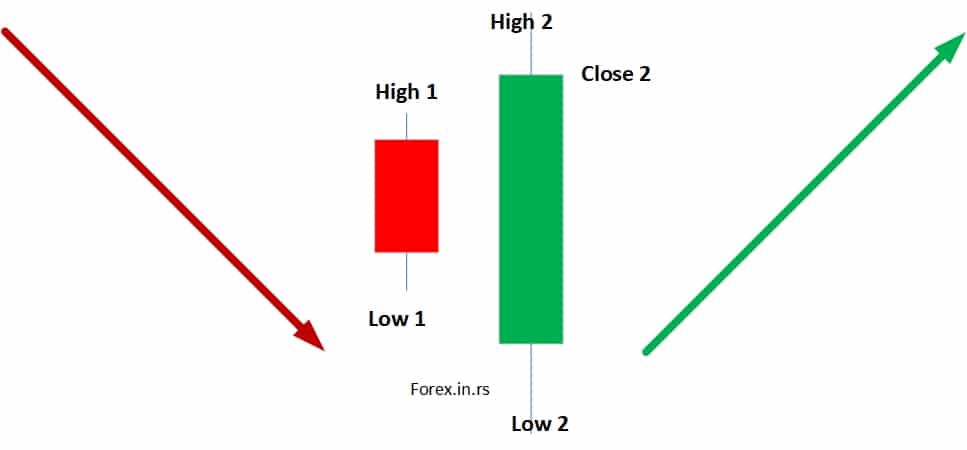

This pattern typically appears at the end of a downtrend and suggests a potential reversal to the upside. It starts with a slight bearish candlestick, representing a period of dominant selling pressure. This candlestick is followed by a more significant bullish candlestick that completely engulfs the body of the first candlestick. The size and color of the second candlestick are crucial; it should be significantly more extensive and of the opposite color to the first one. The sizeable bullish candlestick indicates that buyers are taking control, and the fact that it fully covers the previous day’s candlestick suggests that the downtrend may end. This reversal signal is stronger when the pattern forms near a support level, indicating that buying interest is overcoming the previous selling pressure.
Bearish engulfing pattern definition: The Bearish Engulfing Candlestick Pattern is considered a bearish reversal pattern during rising trends. It occurs when the bearish candle engulfs the smaller bull candle from the previous period.
One of the best things a trader can learn to perform is engaging in trading through a significant sure method to enter the realm of trading moves as the momentum is gaining quicker by applying the engulfing candle day-trading strategy.
In contrast, the Bearish Engulfing pattern occurs at the end of an uptrend and signals a potential reversal to the downside. It begins with a slight bullish candlestick that represents the continuation of buying pressure. The second candlestick is a larger, bearish one that completely engulfs the body of the first candlestick. This pattern suggests that selling pressure has taken over and is strong enough to reverse the uptrend. When the bearish candlestick is more significant and fully covers the previous candlestick, the buying interest has diminished, and a downtrend may be starting. This pattern is more reliable when it appears near a resistance level, showing that selling pressure is overcoming previous buying momentum.
Engulfing trading exceeds the pattern trading strategy based on an algorithm where traders must define the major at the end of the first step and enter into a trade when an engulfing pattern between two candles occurs in the primary trend direction. Enter a long trade when the opening price exceeds the engulfing bullish candle close (Close 2 price). Enter a short trade when the opening price is below the engulfing bearish candle close (Close 2 price).
To summarize:
Bullish Engulfing Pattern
- Formation: This pattern occurs at the end of a downtrend and indicates a potential reversal to the upside. It consists of a small bearish (down) candlestick followed by a more significant bullish (up) candlestick.
- Criteria:
- First Candlestick: A small red (or black) candlestick that represents the continued selling pressure and shows that the bears are in control.
- Second Candlestick: A larger green (or white) candlestick that completely engulfs the previous candlestick’s body, indicating that the bulls have taken control and are reversing the trend.
- Implications: The larger bullish candlestick suggests strong buying interest, and when it covers the entire range of the previous day’s candlestick, it often signals the end of the downtrend and the beginning of an uptrend.
Bearish Engulfing Pattern
- Formation: This pattern occurs at the end of an uptrend and indicates a potential reversal to the downside. It consists of a small bullish (up) candlestick followed by a larger bearish (down) candlestick.
- Criteria:
- First Candlestick: A small green (or white) candlestick showing the prevailing buying pressure and a continuation of the uptrend.
- Second Candlestick: A more prominent red (or black) candlestick that completely engulfs the previous candlestick’s body, indicating a reversal with increased selling pressure.
- Implications: The larger bearish candlestick indicates that selling pressure has taken over, and the fact that it completely engulfs the prior day’s candlestick often signals the end of the uptrend and the start of a downtrend.
Daily Candle Engulfing Pattern Trading Strategy Case Study
Let us create one trading strategy. Rules are:
Buy on the following day’s open price if we have a bullish pattern on the daily chart:
If Low 2 < Low 1 AND High 2 > High 1 AND Close 2 > ClsignificantStop loss: Low 1
Target: Risk/Reward 1:1
Sell on the next day’s open price if we have a bearish pattern on the daily chart:
If Low 2 < Low 1 AND High 2 > High 1 AND Close 2 < Close 1
Stop loss: High 1
Target: Risk/Reward 1:1
We tested this strategy using the daily candle EA test on significant forex pairs. We wanted to see the results.
The number of trades: 8953
The average winning ratio for the Daily Candle Engulfing Pattern Trading Strategy was 54%
We had the best results when we tested high-volatility currency pairs such as GBPUSD or GBPJPY, and the lowest performance was on low-volatility currency pairs. Our expectations were much, so weer. We tried to add a rule to improve performance.
We noticed that the results are much better if we have a bullish engulfing pattern and the Close 2 price is near the High 2 price.
And, of course, if we have a bearish engulfing pattern and the Close 2 price is near the Low 2 price, the results are much better, too.
Close 2 price needs to be above SMA 50 for a bullish trend and below SMA 50 for a bearish trend on the daily chart.
Our new rules are :
Buy on the following day’s open price if we have a bullish pattern on the daily chart:
If Low 2 < Low 1 AND High 2 > High 1 AND Close 2 > Close 1 AND Close 2 > SMA 50
Stop loss: Low 1
Target: Risk/Reward 1:1
Sell on the next day’s open price if we have a bearish pattern on the daily chart:
If Low 2 < Low 1 AND High 2 > High 1 AND Close 2 < Close 1 AND50
Stop loss: High 1
Target: Risk/Reward 1:1
The number of trades: 8953
The average winning ratio for the Daily Candle Engulfing Pattern Trading Strategy was 59%
The essential characteristic of the Engulfing pattern is the size relationship between the two candlesticks. For the pattern to be considered valid, the body of the second candlestick must fully encompass the body of the first one. The larger the second candlestick compared to the first, the stronger the signal. The volume also plays a role; increased volume during the pattern formation can enhance reliability, indicating more robust buying or selling pressure.
When trading based on the Engulfing pattern, the entry point is often set just above the high of the bullish engulfing candlestick for a buy order or just below the low of the bearish engulfing candlestick for a sell order. To manage risk, stop-loss orders are typically placed just below the low of the bullish candlestick or just above the high of the bearish candlestick. Historical support and resistance levels or technical indicators can determine profit targets.
Despite its usefulness, the Engulfing pattern has limitations. It can produce false signals, mainly if used in isolation. Therefore, confirming the pattern with other technical analysis tools, such as trendlines, moving averages, or additional indicators, is essential. The pattern’s effectiveness can also vary depending on the broader market context; patterns that appear during strong trends might be less reliable than those formed at the end of a prolonged trend.
About engulfing candles on charts
The broad sections of candlesticks noticed on a candlestick pricing chart are natural bodies. When a candle is bearish or down, the upper part indicates the used price at the opening phase, while the bottom part indicates the price at the closing phase regarding the period that is being observed. The color red or black is frequently used to denote the body of a down candle. On the other hand, the color green or white is often used to describe the existing body of an up candle. Both low and high ones can be presented via thin lines in essence, which resemble the appearance of wicks of a candle. These lines surpass the boundary of the natural body.
Suppose a tisolateenvelopment about the prior up candle by the natural body about a down candle day trading bearish necessary to determine envelopment about the last down the entire body about determine the order in which bullish engulfing t is an excellent idea to conduct uptrend occurs comes to applying the higher-swinging highs and lows in the determination of the predominant direction of the trend. This will result in the order the trader will apply to perform their trades.
An uptrend occurs when prices possess higher-swinging highs and lows. Prices are noted to follow the momentum of a wave pattern, whereas they engage in advance, such as drawing backward and moving forward once again. The trader should be careful only to implement long-term positions in the uptrend, which the trader will propose to sell at a relatively higher price.
There is a downtrend in such cases where the price possesses lows, such as lower-swinging and lower-swinging. In the case of a downtrend, the waves are in a state of decline, meaning they are larger than the pullbacks and are higher. As a result, this produces a lower form of progress overall. When there is a downtrend, the trader will implement short positions to sell an asset in t selling borrowed based on desiring to purchase and return it later at a lower rate.

He is an expert in financial niche, long-term trading, and weekly technical levels.
The primary field of Igor's research is the application of machine learning in algorithmic trading.
Education: Computer Engineering and Ph.D. in machine learning.
Igor regularly publishes trading-related videos on the Fxigor Youtube channel.
To contact Igor write on:
igor@forex.in.rs
