Table of Contents
The Megaphone chart pattern was first described in Richard Schabacker’s 1932 book: “Technical Analysis and Stock Market Profits.”
What is a megaphone chart pattern?
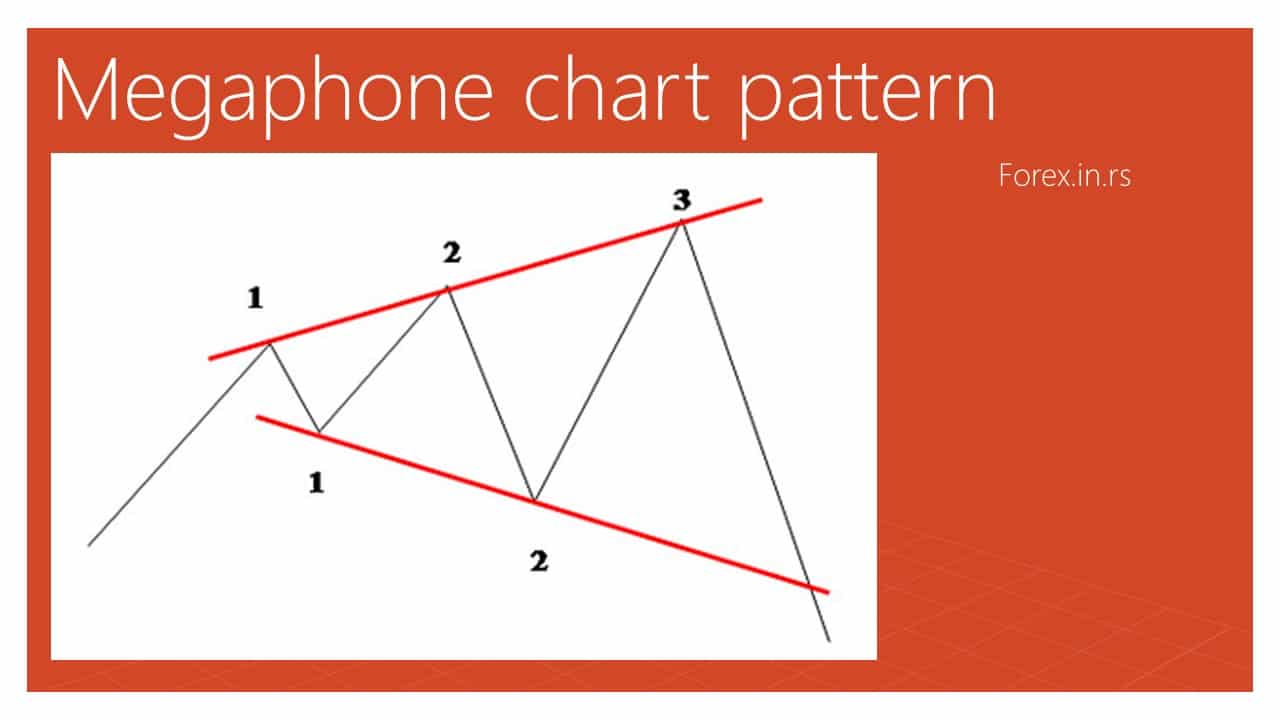
A megaphone chart pattern (a well-known term) or Broadening wedge formation is a reverse symmetrical triangle trading pattern formed by increasing price volatility. It is diagrammed as two diverging trend lines, one rising and one falling. The megaphone pattern consists of two higher highs and two lower lows, forming during high-volatility periods.


The Bullish Megaphone chart pattern, also known as the Broadening Formation or the Reverse Symmetrical Triangle, is a technical analysis pattern that appears on charts of financial assets. It is a broadening price pattern that consists of two sloping trend lines, one going up and the other going down, that diverge from each other.


See my video from my YouTube channel:
The Bullish Megaphone pattern is formed when the asset’s price action makes higher highs and lower lows within the pattern, meaning that the range of price movement is widening over time. However, unlike the bearish megaphone pattern, the Bullish Megaphone pattern signals a potential reversal of the current downtrend.
The pattern is usually identified by the formation of higher lows, which indicate that buying pressure is increasing in the market. The price action swings become more volatile, with more significant price movements in both directions. The pattern is typically completed when the price breaks above the upper trend line, confirming the bullish reversal.
The Bullish Megaphone pattern is considered a powerful bullish signal, suggesting that the underlying asset may experience a strong uptrend. Traders and investors often use this pattern to identify potential buying opportunities in the market. However, as with any technical analysis pattern, it is essential to consider other factors, such as market fundamentals and economic indicators, before making any investment decisions.

Megaphone chart pattern characteristics
- Broadening price pattern: The Megaphone pattern is a broadening price pattern, meaning that it consists of two sloping trend lines, one going up and the other going down, that diverge from each other.
- Higher highs and lower lows: Within the Megaphone pattern, the price action makes higher and lower lows, meaning that the range of price movement is widening over time.
- Increasing volatility: As the price action moves back and forth between the two trend lines, the price swings become more volatile, with more significant price movements in both directions.
- Uncertainty: The Megaphone pattern is often seen as a sign of uncertainty in the market, as traders and investors struggle to determine the direction of the price action.
- Reversal potential: While the Megaphone pattern can be seen as a bearish signal, it also has the potential to signal a reversal of the current trend. This is because the widening price range can create pressure for a breakout in one direction or the other.
- Volume: Volume can play an important role in confirming the Megaphone pattern. As the pattern develops, the volume will increase as traders become more active in response to the volatility.
- Time frame: The Megaphone pattern can appear in any time frame, from intraday charts to weekly or monthly charts, and can be seen in any financial asset, from stocks to currencies to commodities.
Another chart pattern employed in technical analysis is the megaphone pattern. Again, the wide formation hints at the increased risk associated with change.
The stock market comprises two giants—buyers and sellers. The contest between the duo forms patterns in the market. Therefore, knowing and identifying what patterns stand for is very important.
How megaphone patterns form earns them a name: ‘broadening formation.’ Due to high volatility, stocks migrate without a definite direction, thus forming megaphone patterns. As a result, higher gets high, and lower gets low simultaneously.
Nevertheless, using a megaphone pattern can produce both lower lows and higher highs. As a result, there is no direction. Therefore, an essential aspect of this pattern is trend lines.
Example: Bullish megaphone chart pattern on a Weekly timeframe
What does a long-term megaphone pattern mean? In this case, we can see a bullish trend several weeks after forming the megaphone pattern.
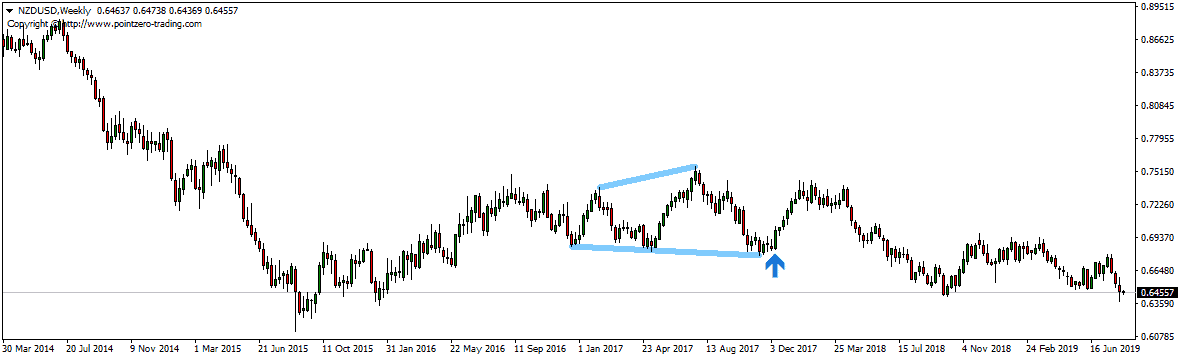
Thus, one must be good at joining the dots; else, it assumes a triangle pattern. This will end up changing the way one trades.
Example: Berish megaphone chart pattern :
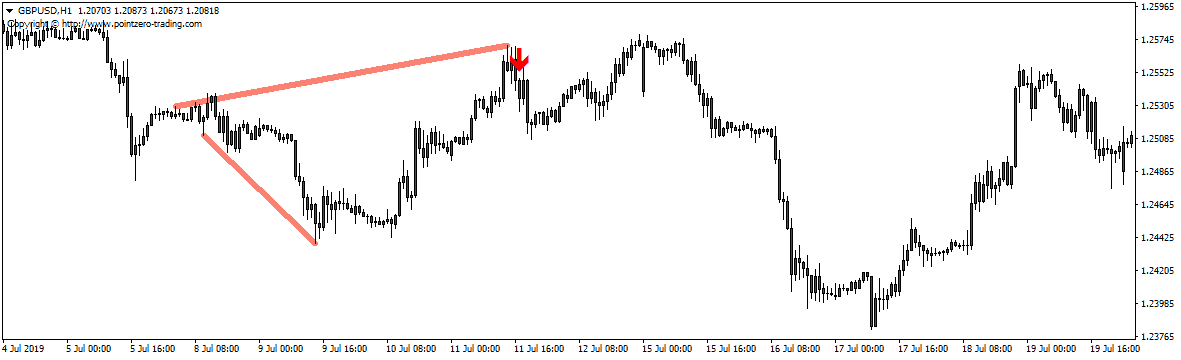
Broadening formations are formed by using the trend line to link the higher highs and lower lows. Thus, the shape of megaphone patterns is like a reverse triangle.
Megaphone stock pattern
A megaphone stock pattern is a widening pattern that resembles a megaphone or reverses a symmetrical triangle.
Trading megaphone pattern
To trade a megaphone pattern, we must detect two higher highs and two lower lows formed during high volatility periods. If we see a bullish trend breakout, we will sell, and if we see a bearish trend breakout, we will buy.
Megaphone patterns start forming when the market begins to experience higher risk for an extended period. One of the key factors contributing to megaphone formation is the election. The reason is that electing a particular leader can change the affairs of a country, which later affects the market. Since the political climate is unstable, the market keeps fluctuating.
Megaphone pattern also forms as a result of the earnings season. Earning reports from companies affect the stock. Earnings may have both good and bad sides. This causes different reactions, and one such reaction results in a broadening formation.
Megaphone patterns are usually seen as bearish because they are reverse symmetrical triangles. At the same time, regular symmetrical triangles are neutral.
Is the coil pattern the same as the megaphone stock chart pattern?
No, the Coil pattern is the symmetrical triangle, and the megaphone pattern is the reverse symmetrical triangle.
Swing and day trading both capitalize on volatility. Single direction has always been a suitable path that long-term investors want to trade.
Our day trading course will help you successfully trade various patterns. It is better to trade around the trend lines in a volatile way. Based on one style, it’s best to go long when hitting angular support. Also, when hitting angular resistance, go short.
A significant part of technical analysis is trend lines. This results in swing and day traders profiting from the change of a broadening formation.
Up to 2 weeks, Swing trading holds overnight. It all has to do with one risk management. Technical pointers are in place to assist one in and out of trades as soon as possible. The trend lines can be used as entry and exit points and stop losses. The broadening of megaphone patterns indicates a higher profit potential. This can also be indicative that the potential for loss is more elevated.
Thus, there’s a need to trade with effective risk management. Use the technical pointers to self-advantage. The small candlestick 2 to 3 patterns are also helpful. The combination of these can provide great entries as well as exits.
Megaphone chart pattern case study
Methodology: In our research, we tried the Pointzero Megaphone indicator (an excellent megaphone chart indicator) and tested the last ten years for EURUSD, GBPUSD, USDCAD, AUDUSD, NZDUSD on H1, H4, and Daily charts.
We created a test using the Visual Testing tool in Metatrader :
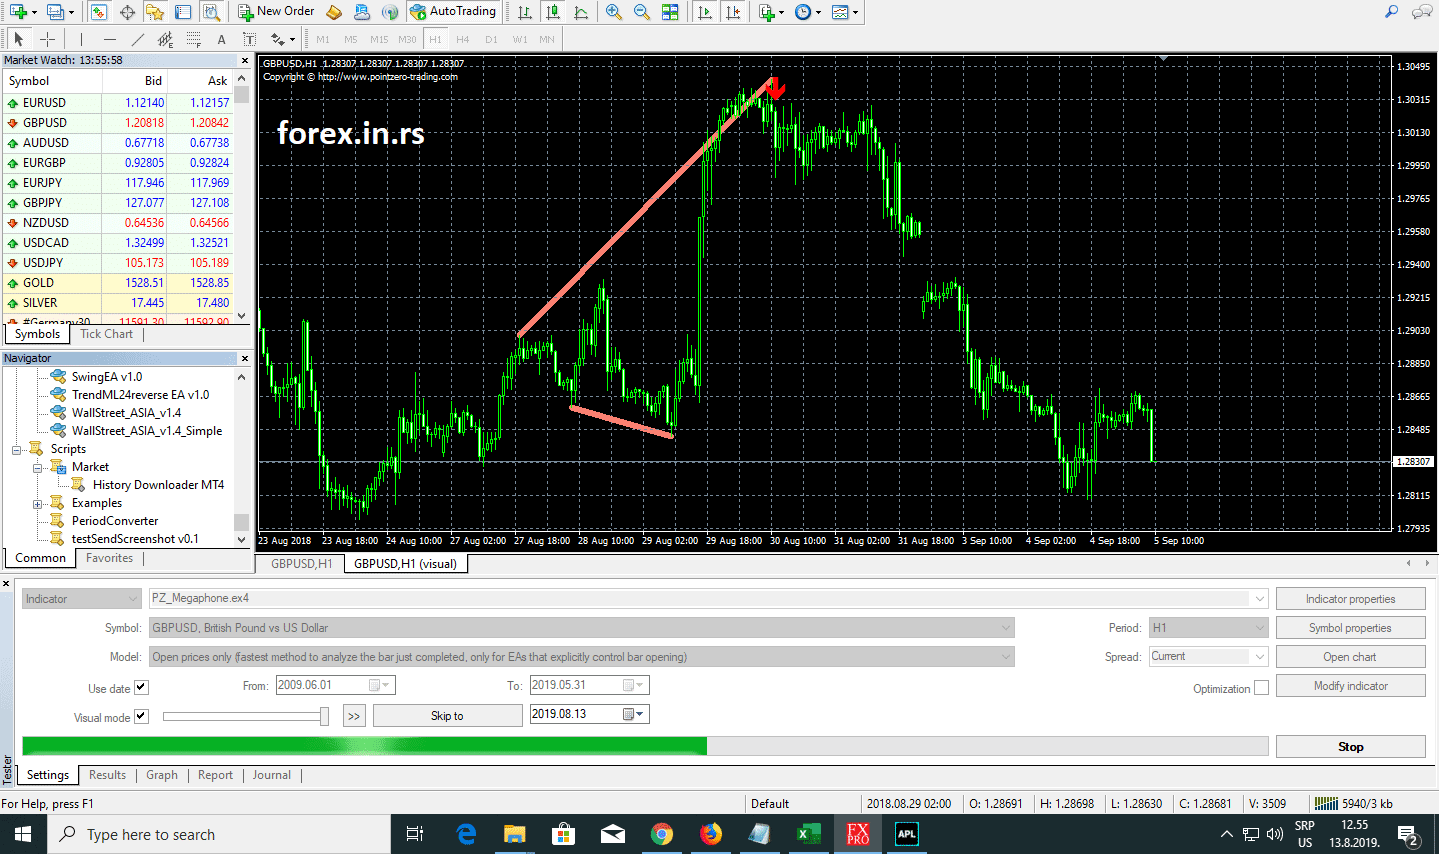
Results :
| Currency pairs | H1 chart | H4 chart | Daily chart |
|---|---|---|---|
| EURUSD | 51% | 54% | 55% |
| GBPUSD | 45% | 48% | 47% |
| USDCAD | 47% | 49% | 51% |
| AUDUSD | 50% | 53% | 51% |
| NZDUSD | 45% | 49% | 52% |
Discussion :
The results were terrible. We tried to see at least a 1:0.8 risk-reward ratio. Test results will be worse than our research for one risk and reward.
Visual and manual observations make our tests, so we accept any critique.
Trading Megaphone pattern:
How do we trade megaphone patterns?
The trading megaphone pattern implies a reverse symmetrical triangle trading pattern identification, but it is a very complex strategy because many false signals exist. The approach uses basic price levels for stop loss, enter position, and target and several additional triggers, not only megaphone patterns. For example, divergence, trend lines, and megaphone patterns are excellent triggers for entering trades.
Megaphone patterns are often most suitable for day and swing traders. However, long-term investors can also use them as a sign to support their investments. Like any trading style, it is better to study and learn the different patterns and what they stand for.
I often wondered, “How do you trade the megaphone pattern intraday?” I avoid trading this pattern on lower time frames and intraday and try to use it only on H4, Daily, and Weekly chart time frames.
The practice trading account begins with opening a paper trading account. As a result, you’ll get good at drawing trend lines and linking the dots to arrive at different patterns, which is a crucial part of trading. In my opinion, the success rate, based on our tests, the success rate is terrible, and we avoid using this pattern in the trading decisions for smaller time frames. Of course, the weekly and monthly charts can be interesting for this pattern.

He is an expert in financial niche, long-term trading, and weekly technical levels.
The primary field of Igor's research is the application of machine learning in algorithmic trading.
Education: Computer Engineering and Ph.D. in machine learning.
Igor regularly publishes trading-related videos on the Fxigor Youtube channel.
To contact Igor write on:
igor@forex.in.rs
