Table of Contents
Traders often gain profits by determining the price trends beforehand and favorably adjusting their actions. The most preached strategy to find out about stock value is through movement study based on the latest trends. This trend analysis gives an overview of the bull market, or simply the market where the price increases. Unfortunately, it can often turn the cards by trodding down to a bear market. But what is the meaning of the bullish reversal?
When the bear market moves opposite of its downward direction, a bullish reversal takes place. This helps traders spot opportunities for a perfect exit or the chance to indulge in more trading activity. However, an overview is hardly enough to become an expert in recognizing a bullish reversal. Hence, we have created this article to give you more condensed knowledge about the bullish reversal.


What is Bullish Reversal?
Bullish reversal represents a trading pattern when a downside trend on the chart begins to move in the opposite direction. Bullish reversal patterns indicate the possible future rising trend.


Is bullish reversal good?
Yes, a bullish reversal pattern is an excellent trigger for BUY trades but only in combination with other technical and fundamental triggers. The best results bullish reversal patterns give when price touch a vital level (weekly high, weekly low, monthly high, monthly low, etc.), the bullish gain can be significant.
The stock market consists of 2 types of players. The first are the people who intend to buy the securities and increase the prices. On the other hand, some people have the intention to sell the shares and lower the prices. Trend analysis is the study of perceiving the opportunities on either side and making sound investment decisions. For instance, a bullish market indicates not to short your stock. Hence, being proficient in the identification of the market stages is crucial for building money making portfolio.

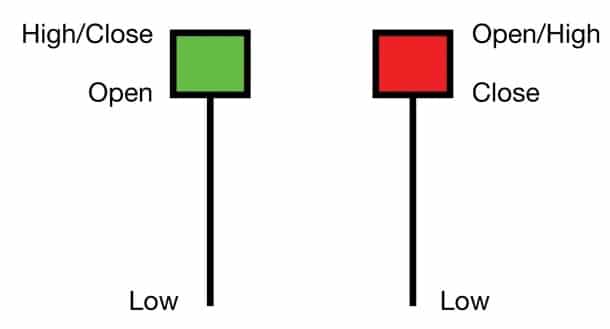
A Japanese candlestick aid in the exhibition of data for the movement of prices of the asset. It comprises up to and down movement along with the summary of opening and closing prices. Thus, it is a prominent tool traders use to analyze the market and pan out the information about asset prices.
The three characteristics of the candlestick are:
- First, the body determines the open and close range.
- Colors are the determinants of the price direction. For example, red and black symbolize a fall in price, while white and green color means an increase in the price.
- Wicks indicate towards the low and high points.
Bullish reversal candlestick patterns
Bullish candlestick patterns are triggered following the downward trends, indicating an inversion in the movement of prices. Traders use this pattern recognition technique to find the suitable time for opening long positions and profiting from this upwards shift.
Bullish candlesticks insinuate many things, including the existence of buying force or a reversal signal. However, here are some patterns that aid the traders in finding their stance in the market for a good day.
The bullish hammer
A bullish hammer is visible near the base of the downward trend. This consists of a long wick that is low while the short body is on the upper side. The name is derived from its semblance. This pattern indicates that even if there is pressure to sell in the daytime, the prices will rise again due to the hefty purchasing pressure. The bull market goes on strong if the color of the candlestick is not red but green.
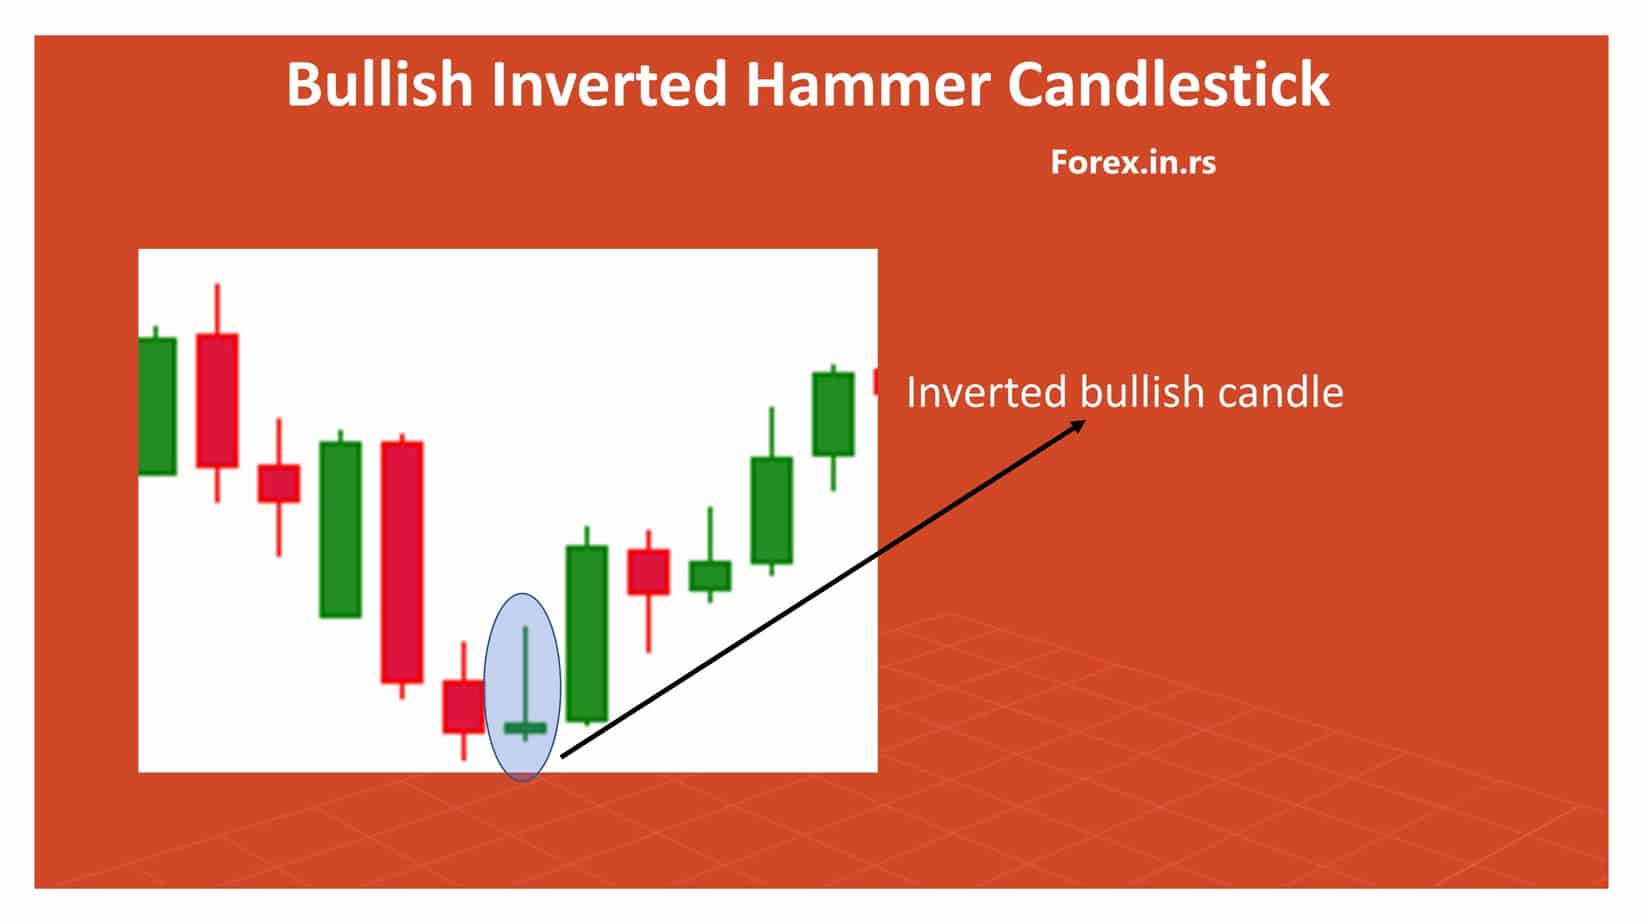
Bullish inverted hammer
The hammer and inverted hammer are similar in some aspects, with some differences in appearance. The inverted hammer has a short body accompanied by an upper wick that sports a long length. This pattern can be seen in a downward trend after a black body.
This pattern determines that the pressure to sell after the buying trend is insufficient to downward the stock price. Conversely, if it has an upward wick, understand that bulls are trying to take over the market through tactics to raise the price.
The shooting star and inverted hammer are often confused with each other. However, the shooting star is different because it is dominant on rising price trends and indicates a bearish market.
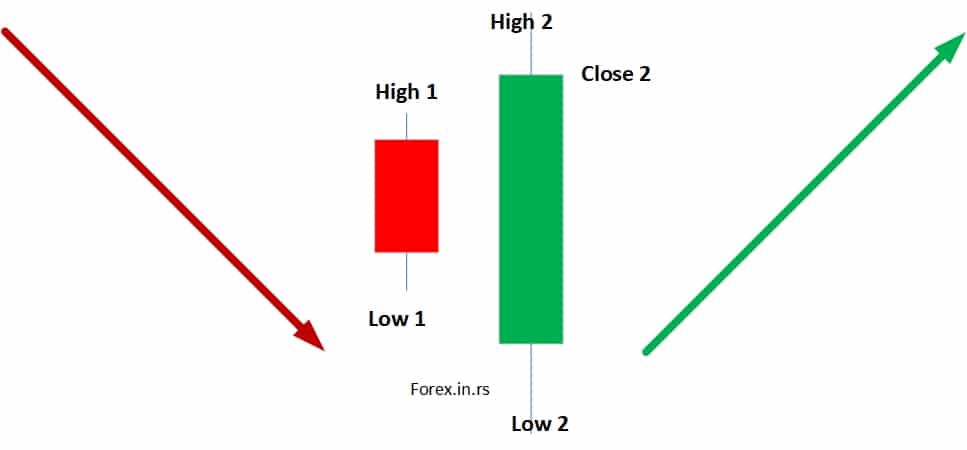
Bullish engulfing
The bullish engulfing pattern consists of 2 candlestick patterns. The first candle has a short body. The other candle engulfs the former. The first candle often sports red and black color and the 2nd one is white or green.
In more situations, the white wick can have a slight upper wick. It determines if the closing price might be the highest of the day. When there is no upper wick, it signals that the prices will be much higher the next day, and this is a white-colored candlestick. A black candlestick may also upper on the following day after witnessing an opening gap.
This bullish engulfing pattern comes out of hiding when the prices are lower on the 2nd day than on the first day. If this does not occur, the white candlestick will not engulf the black-colored candle for the next day.
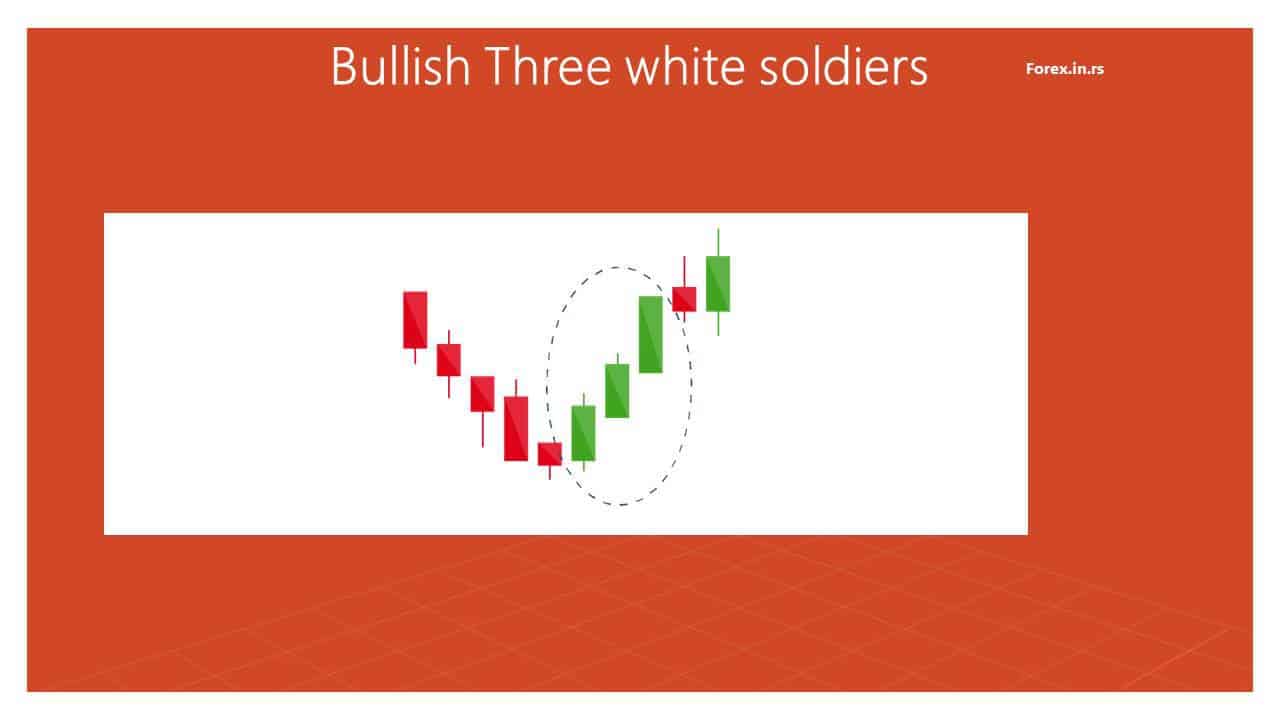
Bullish Three white soldiers
This occurs in the presence of 3 long bullish candlesticks that gesture towards a reversed downtrend. The three candlesticks have openings that lower after every consecutive one, and the closing price increases every time. The bodies of these candles are long, with a short wick providing an appearance like a staircase.
The bulls are predominant in this pattern, and they lead to high closing prices. These three white soldiers can be utilized as entry and exit points by traders.
If you are leaning towards a bullish position, this might be a good entry point for you. At the same time, you should exit if you have fewer securities. However, before making any decision, make sure to study the pattern.
If these candles are long, short-sellers can take over and lead to a fall in the asset.
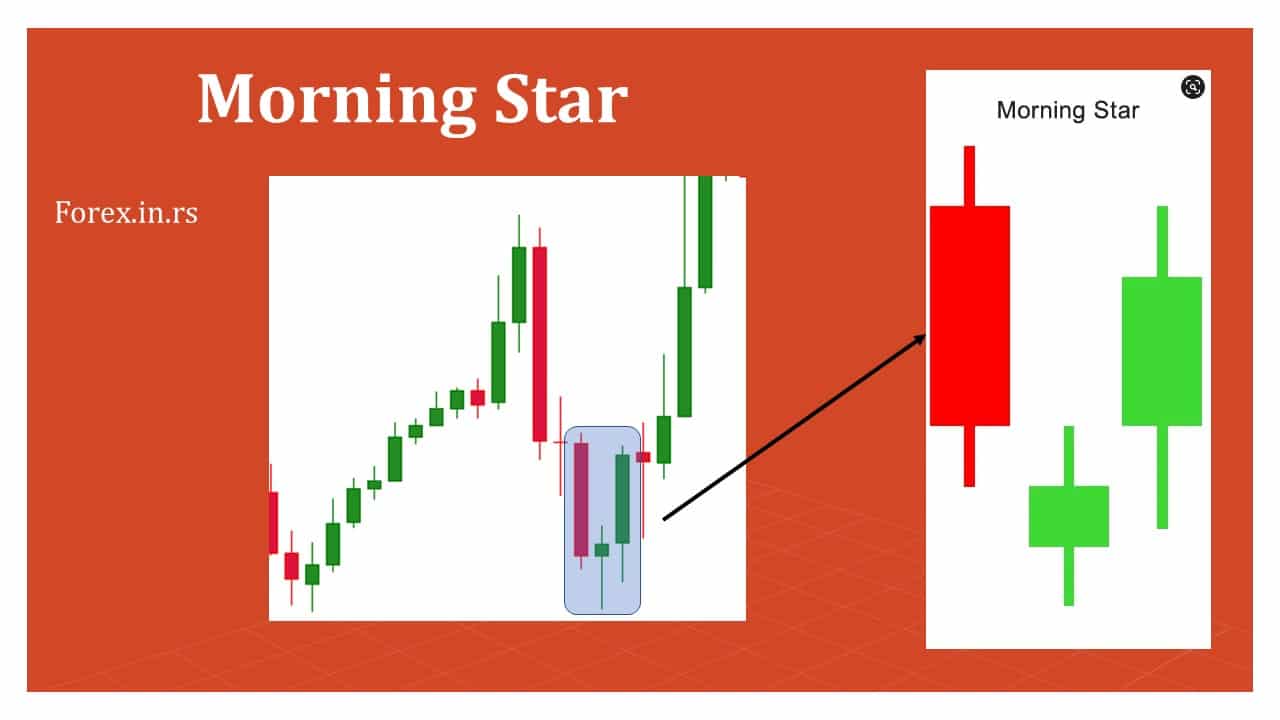
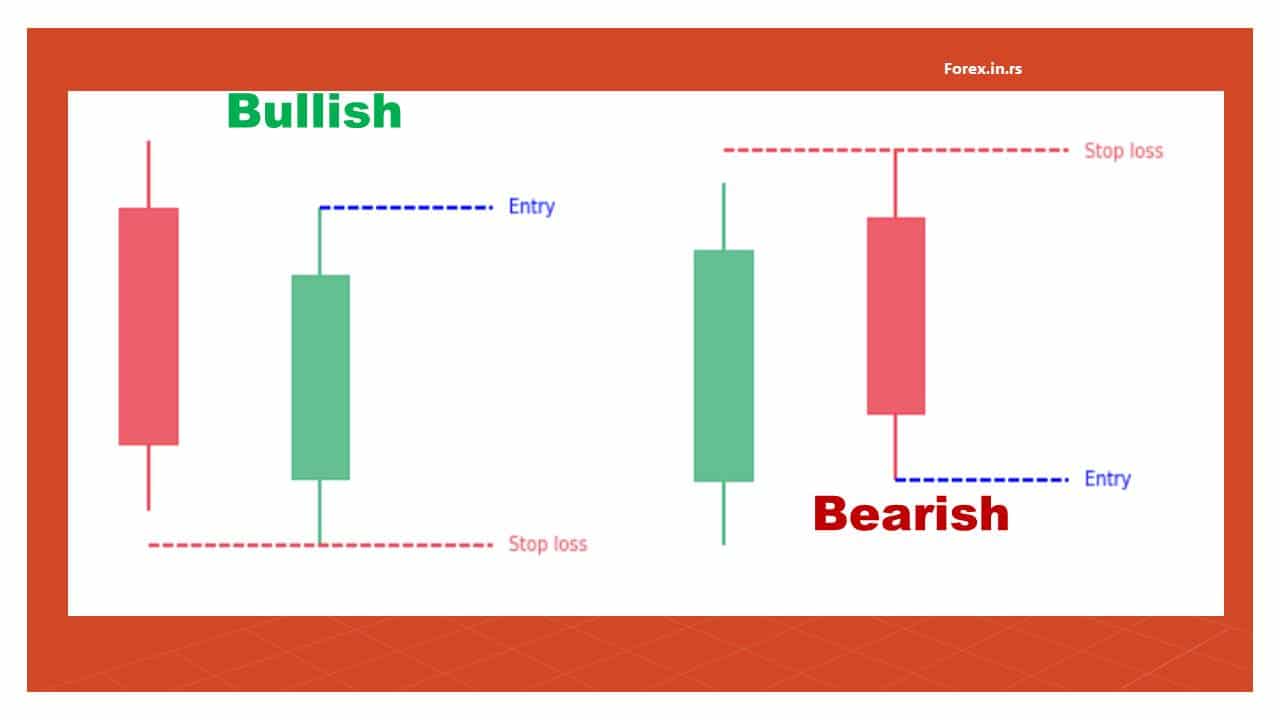
Bullish morning star
This pattern also consists of 3 candlesticks signaling towards a bottom reversal. The pattern starts with a short candlestick, a red or black long candlestick, that forms a star by gaping down. Candle 3 can be green or white. The first session of the black body is closed by this candle.
The bullish morning star shows a slow downward movement, leading to an upward trend before a bullish move. The market flatlines here because the indecisions vanish, and the pressure to sell recedes. Bulls identify this as an opportunity and curb the shares from being sold.
Bullish piercing line
This pattern favors the bullish market and appears near the bottom of a downtrend. It comprises two candlesticks with long bodies. The black or red candle is followed by a white or green candle that is lower.
This coerces to buy because there is a price hike till the mid-price of the former day. This pattern stays for two days, given the 1st is for sellers and the 2nd is for buyers.
Conclusion
These candlesticks patterns help understand the proper entry and exit points and give important information regarding prices, reversal warnings, and trend signals.
Once you are proficient in reading these patterns, you can find the changes in sentiments and define downtrend reversals with avenues for long gains. These candlestick patterns are handy in finding out about future trend reversals. However, ensure that you recheck the existence of reversals by following the price actions before indulging in trade.

He is an expert in financial niche, long-term trading, and weekly technical levels.
The primary field of Igor's research is the application of machine learning in algorithmic trading.
Education: Computer Engineering and Ph.D. in machine learning.
Igor regularly publishes trading-related videos on the Fxigor Youtube channel.
To contact Igor write on:
igor@forex.in.rs
