Table of Contents
In the recent article, we learned basic information about moving average indicators. However, many traders these days use day trading strategies. Very often, on our FXIGOR YouTube channel, I get questions about the best-moving average for this type of chart.
I do not use short periods for trading. As I age, I use more long-term trading strategies or swing trades, and I keep my positions for at least a few days. However, the rule of thumb for every strategy is to make tests. So, if you conduct hundreds of trials and get statistically relevant results, you can choose the proper parameters.


Usually, quant traders use machine learning models to tune and find proper indicator parameters. However, in this article, I created a simple testing strategy that you can also do. Instead of Metatrader, we will use TradingView (read our review).


To learn how to backtest in Tradingview, visit our page.
I will present you my personal research (case study) and my personal view:
The Best Moving Average for 5 Min. Chart Case Study TradingView
The best moving averages for the 5-minute chart are 20 MA and 50 MA. Results are generated on major USD forex pairs (EURUSD, GBPUSD, USDJPY, AUDUSD, USDCAD, and NZDUSD) based on 72 tests on the TradingView platform.

We created one more experiment for a 15-minute chart, too.
The best Moving Averages for a 15-minute Chart are 8 MA and 13 MA. Using the same strategy, we implemented all tests on six major forex pairs and got similar results.
We used only a five-year time frame for each test.
Experiment methodology:
Step 1: Visit the TradingView page for strategy testing.
You can get a premium pro account here, but you need free for this experiment:
Step 2: Choose a wished chart and set the time frame to be 5 minutes.
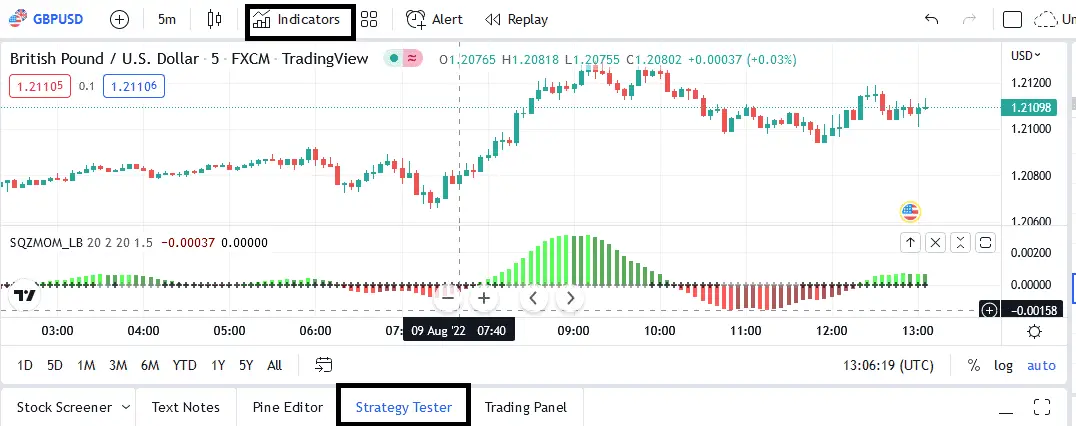
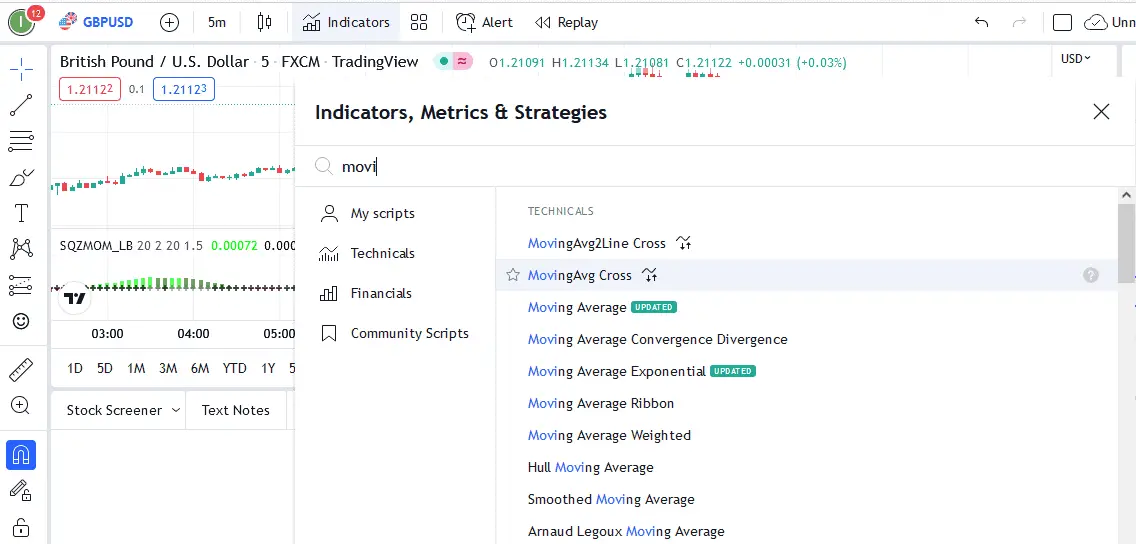
Step 3: Choose MovingAvgLineCross from the list of scripts. Using this EA, you will buy when you have a bullish cross and sell after a bearish cross. In this case, you can evaluate which period crosses are the best.
Step 4: Set periods and test strategy.
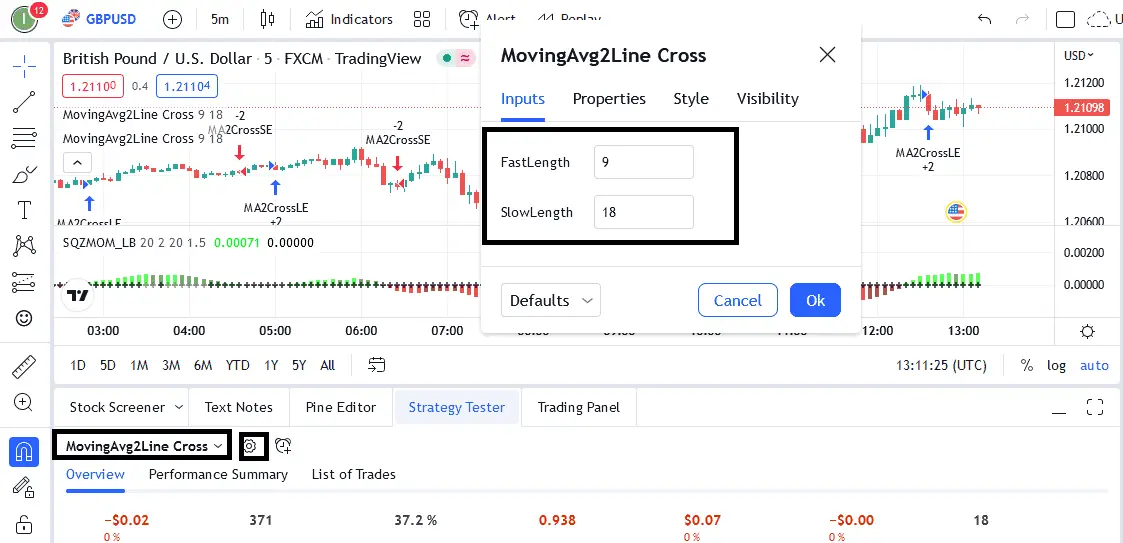
You will get the profit factor and testing results in just a few seconds.
The Best Moving Average for 5 Min. Chart Case Study MT4
If you like MT4, you can test and choose the best-moving average for the 5-minute chart. In this case, you need to download our EA for moving average crossover:
Download Moving Average CrossOver EA
Steps:
- Download MT4 EA to test moving average crossover for different periods.
- Copy .ea expert advisor into Experts Folder.
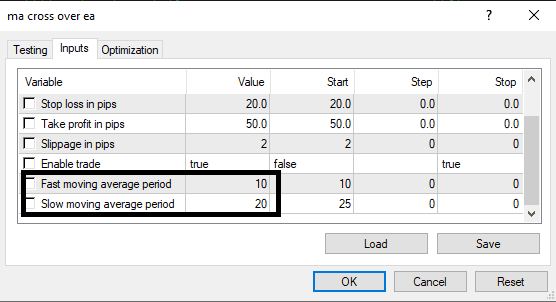
- The EA inputs set periods in the fields “Fast moving average period” and “Slow moving average period.”
- Run EA and test various variations.
Case Study results
We made a lot of combinations of moving average periods. We tested significant currency pairs in the last ten years, from 2012 up to 2022. For each currency pair (EURUSD, GBPUSD, USDJPY, AUDUSD, USDCAD, and NZDUSD), the test is done using a per one-period combination, and the average profit factor is estimated.
| Fast Period | Slow Period | Average Profit Factor for major USD forex pairs |
|---|---|---|
| 20 | 50 | 1.23 |
| 8 | 23 | 1.18 |
| 10 | 25 | 1.11 |
| 8 | 32 | 1.05 |
| 10 | 30 | 1.03 |
| 8 | 16 | 0.99 |
| 8 | 13 | 0.97 |
| 50 | 200 | 0.9 |
| 20 | 100 | 0.87 |
| 100 | 200 | 0.77 |
| 50 | 100 | 0.74 |
| 10 | 20 | 0.56 |
The profit factor represents the average profit factor estimated from 6 test results for six major forex pairs.
Period combinations are made based on finance literature and trading experience.
Conclusion
High-volume traders usually use periods such as 10, 20, 50, 100, and 200 in their trading routine. Because of that, the case study result is not unusual. However, periods 8 and 23 showed significant statistical impact in our results, so if you are a day trader and trade on 5-minute charts, you can use our results to improve your trading.

He is an expert in financial niche, long-term trading, and weekly technical levels.
The primary field of Igor's research is the application of machine learning in algorithmic trading.
Education: Computer Engineering and Ph.D. in machine learning.
Igor regularly publishes trading-related videos on the Fxigor Youtube channel.
To contact Igor write on:
igor@forex.in.rs
