Moving Averages (MA) facilitates technical analysis by smoothing the price data constantly updated after a set time interval. The second-generation trader, Alan Hull, developed a Moving Average. The fund manager, writer, I.T. expert, businessman, and speaker wanted to create an MA that could respond to the current price activities and maintain the curve’s smoothness. Thus, the Hull Moving Average was created in 2005. This Moving Average claims to be more competitive and accommodating than the other MAs as it strives to eliminate lag while improving curve smoothness.
What is Hull Moving Average?
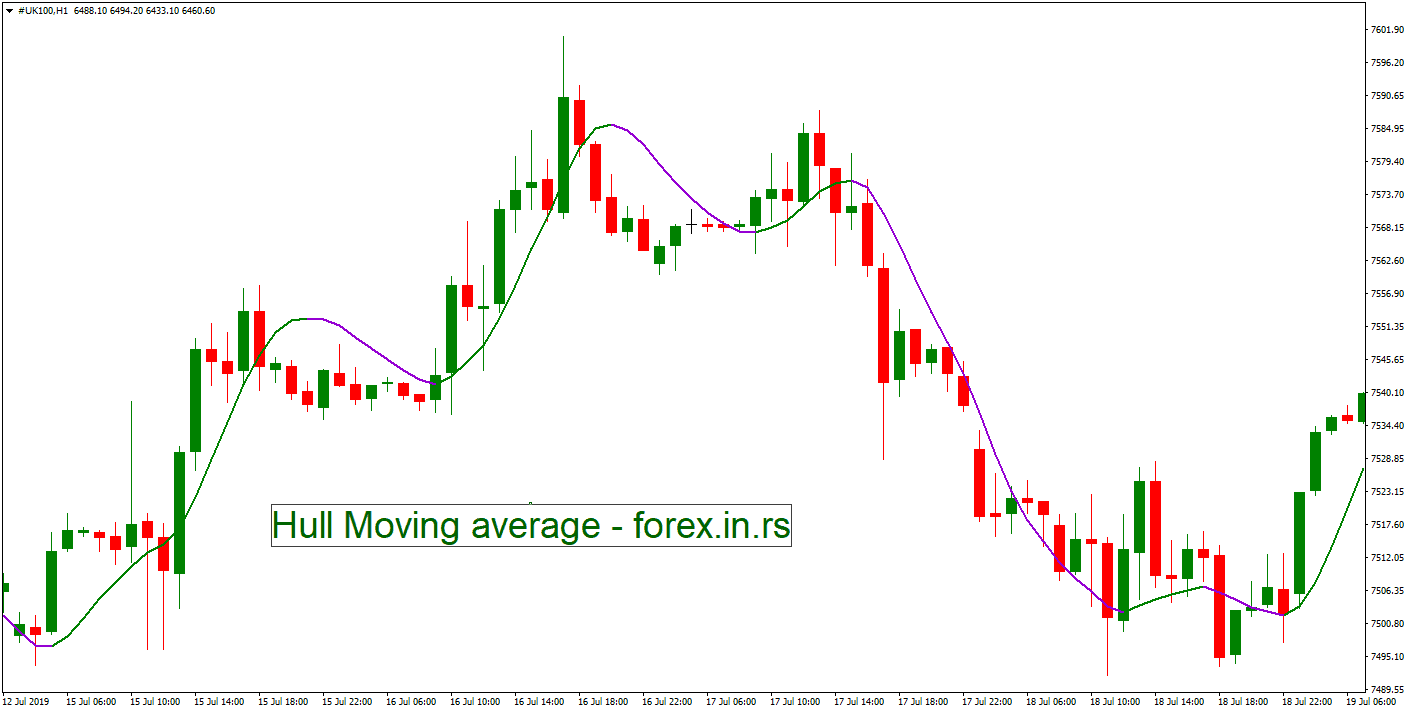
The Hull Moving Average (HMA) represents an extremely fast and smooth moving average developed by Alan Hull. HMA minimizes the lag of a traditional moving average while retaining the smoothness of the moving average line.
Please download the Hull Moving Average indicator for MT4.


Alan Hull moving average formula.
HMA= WMA(2*WMA(n/2) ? WMA(n)),sqrt(n))
To calculate the HMA moving average, it is necessary to do the following five steps:
- Calculate the Weighted Moving Average for some time.
- Reduce the period into two halves by dividing it by 2. Now, use the value to calculate your second WMA.
- Multiply your second WMA by two and subtract the first one from it.
- Find the square root of the new period and take its integer value.
- The final integer you found in the above step will be used to find the third WMA.
Alan Hull developed his Moving Average using the three Weighted Moving Averages (WMA) formula. The WMAs are challenging to build but are more comprehensive and reliable than the Simple Moving Averages. Consequently, you can expect more conducive results from the Hull Moving Average.

Hull moving average Best settings.
The best setting for Hull moving average for long-term trades is 16 weeks-long MA. The best setting for the hourly and daily charts is the default 21-period-long setting.
Many believe that considering a 13-week average would be better as it makes a quarter of the year, but Alan Hull explained the set-up of his Moving Average with the help of a 16-week long MA. Let’s take the same route.
When you are on your trading platform, you will see a column with a list of indicators. Scroll down and select the ‘Moving Averages’ option. This will open another box with various options. You will see a dropdown menu with options like Exponential, Simple, Wider, and more. Choose Hull. You will also get options to set the period.
Once all this is done, you can add this indicator easily to your chart. You can edit the indicator by simply opening the indicator panel. You can change the settings, save everything, and close it. You can delete the indicator as well using the same panel.
. You can do the same by typing the same letter on your keyboard. You will find several color options that you can select by clicking on the desired color patch.
To learn more about moving averages, learn the difference between smoothed andsimple moving averages .
Using the Hull Moving Average for Trading Signals
The Hull Moving Average creator recommends that traders use his creation for directional signals only, as crossovers could face distortion due to lag. You should hold a long position when the Hull Average turns up and opt for a short position when it turns down. You can introduce a longer-term MA in the direction of a signal and then trade in the same direction.
Hull Moving Average Strategy
Hull’s moving average strategy is based on the crossover technique applied to two moving averages to a chart: one longer and one shorter. The trader can enter into a position and exit from the position when a longer and shorter moving average crosses.
For example, we can check a 13-period cross 52-period example or 16 and 32 cross example.
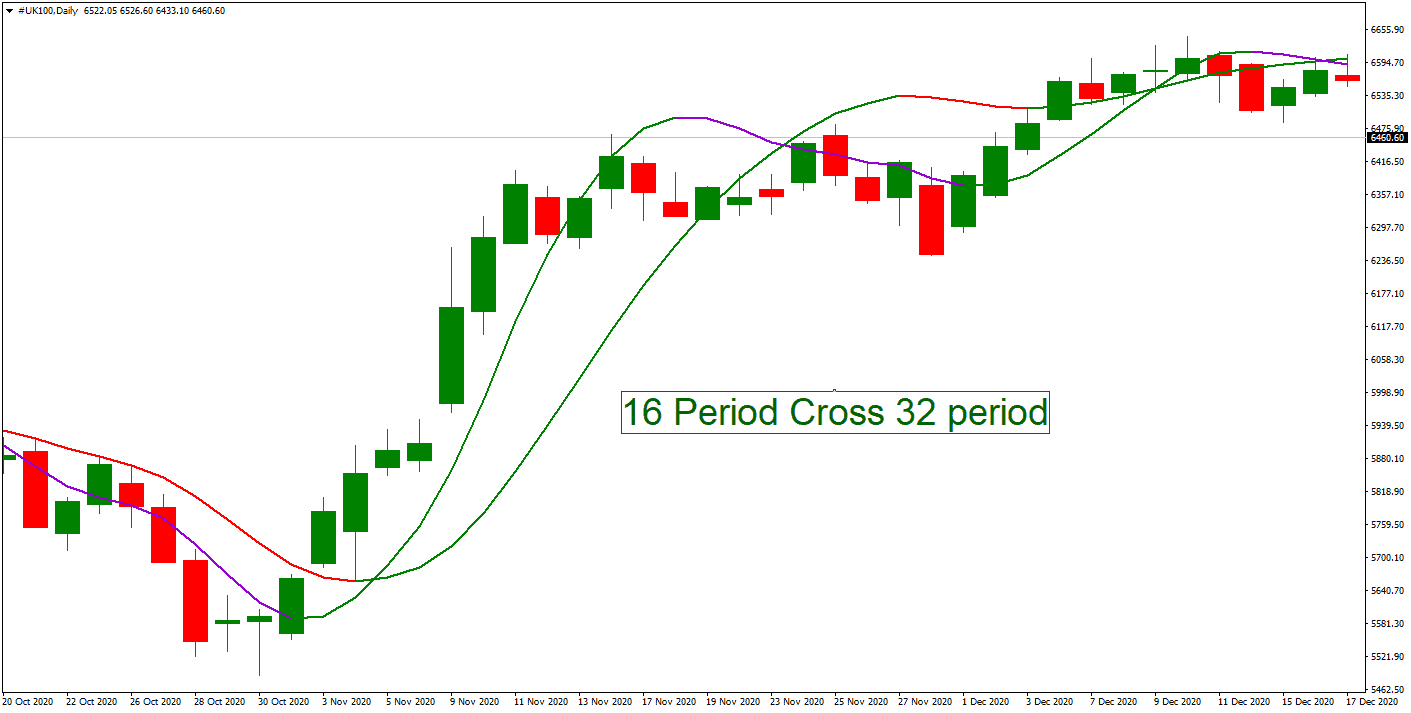
The green 32-weeks Hull MA is our source of trend directions in the above graph, while the trade signals are taken from 16-weeks Hull, MA. The latter is possible only when the 32-week slope is in the same direction.
In the above graphs, the green line means to go long, the red means to go short, and the gray one gives exit signals. These colors can be changed. Read to know-how.
The Hull Moving Average (HMA) can be utilized as a trend-following tool. By determining the correct period of the indicator, one can track an asset whose price is either ascending or descending. If the asset’s price rises, the HMA must stay beneath this price. When the price goes below the HMA, this signals an opportune moment to sell.
One could observe a clear illustration of this principle in specific charts, where the asset price continued its upward trajectory as long as the HMA remained below it. Another method of employing the HMA is to pinpoint crossovers, although this was a technique Alan Hull himself advised against. Many traders will set a 50-day HMA in tandem with a 25-day HMA. The objective here is to discern when these two averages intersect.
For instance, observing specific charts would show that a bullish trend commenced when the two averages intersected at specific points. Yet, there were instances where these crossovers did not instigate a significant trend shift. A third methodology involves amalgamating the HMA with another moving average of identical length, like pairing a 50-day HMA with a 50-day EMA to spot potential crossovers.
In terms of day trading, the HMA offers numerous advantages. Like most moving averages, it’s user-friendly and uniquely reduces the lag commonly associated with other averages. The HMA can be applied to various assets, including ETFs and stocks. Plus, it’s available on most trading platforms, such as MT4 and TradingView. However, there are some drawbacks. Critics argue that its reduced lag compromises its effectiveness as a moving average. Some charts reveal that the HMA doesn’t consistently offer straightforward entry or exit points. Additionally, its computation can be a bit complex for some traders.

He is an expert in financial niche, long-term trading, and weekly technical levels.
The primary field of Igor's research is the application of machine learning in algorithmic trading.
Education: Computer Engineering and Ph.D. in machine learning.
Igor regularly publishes trading-related videos on the Fxigor Youtube channel.
To contact Igor write on:
igor@forex.in.rs
