Forex Education

Trading industry knowledge. Learn forex trading, investing in stocks, commodities.

  • Home
  • Choose a broker
  • Best Forex Brokers
  • Learn trading
  • Affiliate
  • Contact
  • About us
You are here: Home / Technical analysis / Indicators / Download Zero Lag Hull Moving Average with Arrows

Download Zero Lag Hull Moving Average with Arrows

by Fxigor

The Hull MA indicator is an MT4 platform-based indicator for notification of short-lived trends. The HMA indicator is well recognized for putting a greater emphasis on the current price information and generating quick trend-reversal alerts.

Traders look for trend signals depending on current price movements, like making use of EMA – Exponential Moving Averages. Because when used for brief trend monitoring, SMA – Simple Moving Averages trail behind EMAs. Hence, HMA provides forex day investors with both rapid and steady trend trading indications.

Download Zero Lag Hull Moving Average Indicator with Arrows

Below you can download Hull moving average indicator with arrows.

VISIT OANDA - APPLY $10.000 Bonus
BEST BROKERS REVIEWS
avatrade ad gold trading
Trillion Dollar Club - Invest & Trade Stocks, Crypto, Forex
trade oil ads
cfd stocks trade - ad
avatrade ad gold trading

Download Hull Moving Average

VISIT OANDA - APPLY $10.000 Bonus
avatrade ad gold trading
Trillion Dollar Club - Invest & Trade Stocks, Crypto, Forex
trade oil ads
cfd stocks trade - ad
avatrade ad gold trading

BEST BROKERS REVIEWS
free course banner

fxpro android ad
fxpro android ad
100% bonus hotforex
100% bonus hotforex
trade ETF
supercharged bonus hotforex ad
hfm zerpo spread ad
gold trading hotforex ad
crypto trading capital ad
trade oil ads
cfd stocks trade - ad
avatrade ad gold trading
exness stable spread ad
trade metals ad
trade crypto icm

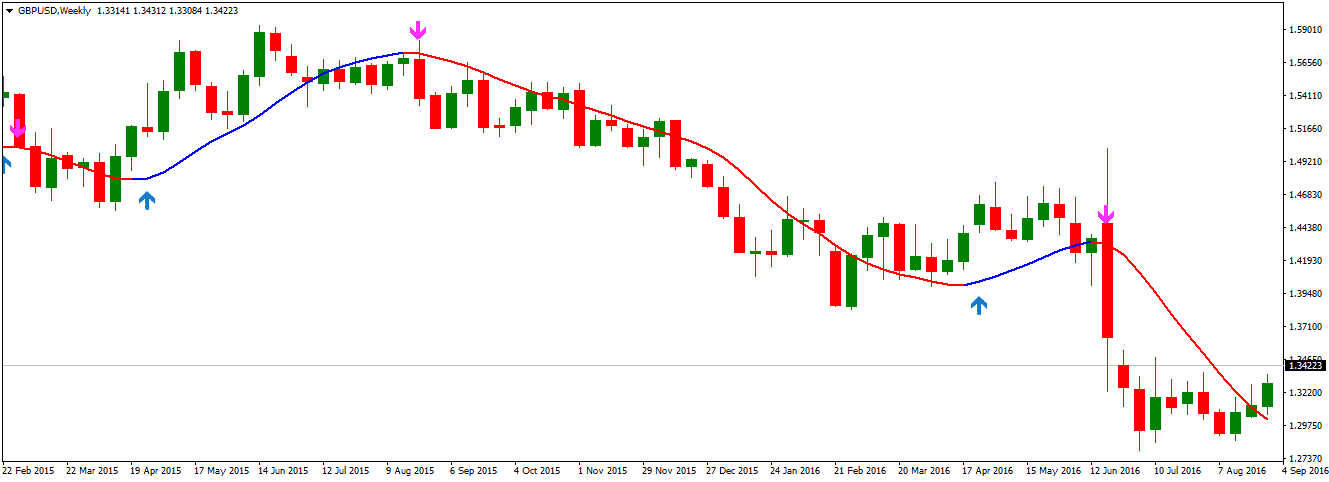
Below you can see chart and Hull MA or HMA with arrows:

VISIT OANDA - APPLY $10.000 Bonus

hull moving average with arrows indicator on chart

Determining forex signals for day trading using HMA

The HMA functions in a similar manner to different moving averages do when it comes to predicting ongoing trend conditions. Because this indicator was created specifically for detecting narrow trends, thus, it will respond quickly to current price movements and deliver more frequent indications. To improve your chances of success, merge the trend indications with the patterns of the candlestick.

avatrade ad gold trading
Trillion Dollar Club - Invest & Trade Stocks, Crypto, Forex
trade oil ads
cfd stocks trade - ad
avatrade ad gold trading

Let us consider an example of the EURUSD chart where at first the stock market was turbulent, with the price moving neither in a positive nor in a negative direction. Several times throughout this timeframe, the price crashed through the Hull Moving Average level. However, due to a very short-term price fluctuation, neither of those alerts was lucrative.

VISIT OANDA - APPLY $10.000 Bonus
BEST BROKERS REVIEWS

VISIT OANDA - APPLY $10.000 Bonus

avatrade ad gold trading
Trillion Dollar Club - Invest & Trade Stocks, Crypto, Forex
trade oil ads
cfd stocks trade - ad
avatrade ad gold trading

free course banner
fxpro android ad
fxpro android ad
100% bonus hotforex
100% bonus hotforex
trade ETF
supercharged bonus hotforex ad
hfm zerpo spread ad
gold trading hotforex ad
crypto trading capital ad
trade oil ads
cfd stocks trade - ad
avatrade ad gold trading
exness stable spread ad
trade metals ad
trade crypto icm

At one point, the value surpassed the HMA line and produced three consecutive bullish candles. Each one of those candlesticks kept on dismissing the indication level and treating it as the zone of support at the same time. As a result, the market trend had shifted to the bullish side after crossing the indication line. Those bullish-pinned bars, on the other hand, indicated that the existing bullish price trend would continue. Following the failure of the support line of HMA, the price performed a powerful upward rise.

To validate a sell signal, the price must finish under the indicator arc, indicating a bearish sentiment trend. Then, search for a negative candle pattern to ensure that the value is staying below the MA line, which serves as a zone of resistance.

VISIT OANDA - APPLY $10.000 Bonus

Final words

The nicest thing about the Hull Moving Average indicator is that it reacts to price movements quicker than other basic moving averages. This indicator’s accuracy has eliminated the long-duration delaying difficulties that standard moving averages had. Furthermore, despite moving near to the value of candlesticks, this indicator increases its filtering outcomes. The HMA indicator, on the other hand, just monitors the recent market developments and notifies you regarding the present trend state. It does not produce subsequent trend signals in the same way that an EMA or SMA crossing does.

  • Author
  • Recent Posts
Fxigor
Fxigor
Trader at Leanta Capital
Igor has been a trader since 2007. Currently, Igor works for several prop trading companies.
He is an expert in financial niche, long-term trading, and weekly technical levels.

The primary field of Igor's research is the application of machine learning in algorithmic trading.

Education: Computer Engineering and Ph.D. in machine learning.

Igor regularly publishes trading-related videos on the Fxigor Youtube channel.

To contact Igor write on:
igor@forex.in.rs
Fxigor
Latest posts by Fxigor (see all)
  • What is the Best Forex Broker in Australia?
  • What is the Best Forex Broker for Spike Trading?
  • How to Backtest Forex Trading Strategy in MT4? – Video & Text Instruction!

Related posts:

  1. What is Hull Moving Average? – Hull Moving Average Strategy Example!
  2. Moving Average High Low Indicator- Download Moving Average Channel Indicator MT4!
  3. Volume Weighted Moving Average Indicator
  4. What is the 200 Day Moving Average or 200 MA?
  5. Smoothed Moving Average vs. Simple Moving Average
  6. What is Moving Average?
  7. What is the Best Moving Average for Volume Chart?
  8. Two Period Moving Average
  9. How to Add Moving Average to RSI in TradingView? – Steps and Video
  10. Moving Average Deviation Indicator
  11. The Best Moving Average for 5 Min Chart – Case Study with Video
  12. Forex Weekly Strategy Based on 200 Moving Average

Filed Under: Indicators

Trade gold and silver. Visit the broker's page and start trading high liquidity spot metals - the most traded instruments in the world.

Trade Gold & Silver

Diversify your savings with a gold IRA.

Gold & silver portfolio-building assistance from product professionals.

VISIT GOLD IRA COMPANY If you want to trade stocks try: TRADE IDEAS

fxpro android ad
fxpro android ad
100% bonus hotforex
100% bonus hotforex
trade ETF
supercharged bonus hotforex ad
hfm zerpo spread ad
gold trading hotforex ad
crypto trading capital ad
trade oil ads
cfd stocks trade - ad
avatrade ad gold trading
exness stable spread ad
trade metals ad
trade crypto icm
VISIT OANDA - APPLY $10.000 Bonus

Website categories

Main Forex Info

  • Forex Calendar 2023
  • Forex Holidays Calendar 2023 – Holidays Around the World
  • Non-Farm Payroll Dates 2023.
  • Fed Meeting Schedule 2023. Dates! – FOMC Dates
  • Key Economic Indicators For a Country
  • What is PAMM in Forex?
  • Stock Exchange Trading Hours
  • Forex Calculators – Calculators & Tools for Traders

Main navigation:

  • Home
  • About us
  • The Best Forex Brokers of 2023 (Ranked & Reviewed)
  • Free Funded Forex Account Without Deposit in 2023!
  • Best Forex Affiliate Programs in 2023.
  • Best Forex Brokers by Monthly Traffic of 2023
  • Brokers That Accept PayPal Deposits
  • Forex brokers reviews
  • Investment
  • Education

Forex social network

  • RSS
  • Twitter
  • FxIgor Youtube Channel
  • Privacy Policy
  • Contact us

Spanish language

Spanish language website
Risk Warning: Trading leveraged products such as Forex and CFDs may not be suitable for all investors as they carry a high degree of risk to your capital. Trading such products is risky and you may lose all of your invested capital. Before deciding to trade, please ensure that you understand the risks involved, taking into account your investment objectives and level of experience.

Copyright Forex.in.rs 2007

Privacy Policy

x
x