Table of Contents
A moving average deviation (MA) is a technical analysis tool traders use to identify price patterns and trends. The MA plots the average of a security’s price over a set number of periods. The deviation measures the distance between the security’s current price and its MA. A positive deviation indicates that the security is trading above its MA, while a negative deviation indicates that the security is trading below its MA.
Traders use the MA deviation to determine when buying or selling a security is appropriate. A security is considered overbought when its deviation reaches a certain level and oversold when it falls below a certain level. Traders can also use the MA deviation to determine when to exit a position.


Understanding and Applying Standard Deviation in Market Analysis


Standard Deviation — the value of the market volatility measurement. This indicator describes the range of price fluctuations relative to Moving Average.
What is the Moving Average Deviation Indicator?
The moving average deviation indicator is derived by calculating an ‘n’ period Simple Moving Average. The sum of the difference between the moving average and the current price brings the required average.
The Moving Average Deviation indicator is a technical analysis tool that measures the average deviation of a security’s price from its simple moving average. The Moving Average Deviation indicator can identify overbought and oversold conditions and generate buy and sell signals.
The Moving Average Deviation indicator is calculated by taking the sum of the difference between the security’s price and its simple moving average, divided by the number of periods used to calculate the moving average.
For example, if a security’s price is $10 and its simple moving average is $9, the Moving Average Deviation indicator would be $1 (10-9 = 1). The higher the Moving Average Deviation indicator value, the greater the deviation between the security’s price and its simple moving average.

The Moving Average Deviation indicator can identify overbought and oversold conditions. When the Moving Average Deviation indicator value reaches a certain threshold, it may signal that security has become overvalued or undervalued and may be due to a price change. The threshold varies depending on the investor’s risk tolerance and market conditions.
The Moving Average Deviation indicator can also generate buy and sell signals. When the Moving Average Deviation indicator value crosses above a certain threshold, it may signal that it is time to buy a security. In contrast, a crossing below a certain threshold may indicate that it is time to sell a security. Again, the points vary depending on an investor’s risk tolerance and market conditions.
Download the moving average deviation indicator for MT4
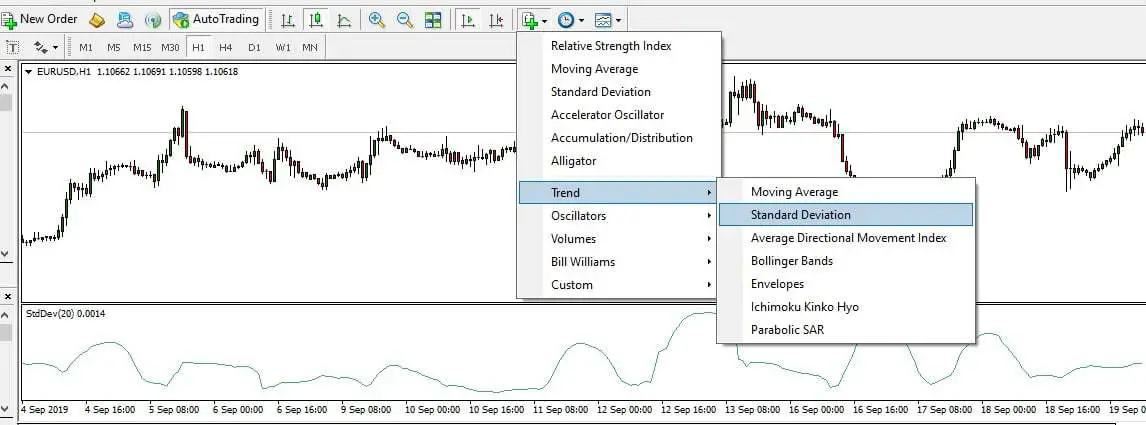
This is the standard indicator of the MT4 platform. You can see the code and download it here: standard deviation indicator forex MT4.
Moving average standard deviation (MASD) is the statistically measured quantity expressing market volatility. MASD does not tell about the direction of market trends.
The moving average is a way to get an overall picture of the trends in collecting data. It is more precisely known as the moving average deviation indicator. It implies the magnitude of volatility in the market. We’ll discuss here the standard deviation (SD) from MetaTrader 4. It applies the forex trade concept and estimates other financial prices to show the details about volatility in the market and its implications for professional traders.
Standard Deviation indicator in Mt4 – this is a common indicator that each MT4 platform has :
The term standard deviation (SD) originates in statistics. SD is the term that finds the quantity of dispersion or variability concerning an average. Further, SD is an amount of volatility. You may be aware of dispersion. Dispersion implies the variation between the average and the actual values. When the dispersion is higher, the SD is going to be higher. Likewise, the SD will be lower when the variability or dispersion is low. Chartists use SD to measure the possible risk and estimate the critical movement at particular prices.
To learn more about moving averages, learn the difference between smoothed moving averages and simple moving averages.
How to calculate the standard deviation?
The standard deviation (SD) can be calculated in 6 steps:
- 1. Determine the average price (the mean) for the given number of observations or periods
- 2. Estimate the deviation for each period.
- 3. Find the square of the deviation for each period.
- 4. Find the sum of s squared deviations.
- 5. Divide the sum obtained in step 5 by the total number of values.
- 6. Now, the SD equals the square root of the number obtained in Step 5.
Note that the average is estimated after the tenth period and applies to all the periods. Determining a moving standard deviation (MSD) is a significant challenge. To render it quickly, you can use MSExel, where you can get the formula.
There are various steps in estimating the SD for a price set. You need to follow these steps:
- Take a specific observation window (say, 20 periods). Estimate the mean average for the price set for the window.
- Find the difference between price and mean in each case.
- Square the value of deviation obtained in the last step.
- Find the sum of values obtained in the last step and divide the sum by the number as many periods to get the variance.
- Find the square root of the deviation to obtain the standard deviation.
The moving average deviation formula calculates how much a moving average varies from the mean. It is calculated by subtracting the moving average from the mean and dividing it by the number of data points. The MAD formula can help identify when a data point is an outlier.
The MAD formula is:
MAD = (x – MA) / n
Thus, the standard deviation is precisely the variance square root driving you home to the unit of measure it was initially expressed.
This formula for SD is used by indicators used in MT4.
Thus, the standard deviation considers the price over a period and plots the histogram representing the SD for the set of observations.
The window of observations is on the move with time, and the old data are replaced by new data each time a new bar showing prices is shown. This helps you get a view of the extent of volatility and its changes. It also helps build your future expectations.
How to calculate average deviation?
To calculate the average deviation from the mean, you need to take the sum of all the deviations and divide it by the number of deviations you have added together.
Values of standard deviation
The SD values depend on the security price. High-price securities, for example, Google, do not reflect higher volatility. SD values are such that they come directly into a relationship with the security price.
Historical SD values are also influenced if security undergoes a change in price in a given period. As a thumb rule, security moving from 10 t 5o is likely to experience a higher SD at 50 compared to what it does at 10.
In the chart, the scale on the left is related to SD. Google’s SD goes up from 2.5 to reach 35. On the other hand, Intel’s security rose from 10 to get 75. Intel’s average price change (deviation) varies between 10 and 75 cents.
There is a difference in ranges; charts can determine the volatility change in security by just glancing at the data. The volatility in the security of Intel increased during April-June. Google showed up a volatility spurt in October as a standard deviation beyond 30. You need to divide the SD by the price at the close to compare volatility for two given securities.
Simplifying the concept of standard deviation
The SD is an indicator that quantifies the extent of recent fluctuation in the price of an asset to bring forth the future trend (how volatile the price will be). Simply put, the standard deviation measures the average gap between the data values in the set means.
The SD is a concept from statistics to describe the distribution of a data set value.
The standard deviation has a value to indicate how deviated the distribution values are from the average value for the given set of data. When the SD is higher, it has more broadly spread values in the data set. Likewise, the values are narrowed and distributed when the SD is less. We’ll elaborate it here a little:
High standard deviation
In high standard deviation, the price moves up considerably from the values they were at before. A high SD indicates the data points spread over an extensive value range.
Low standard deviation
Contrariwise, when the standard deviation is low, the price is stable, showing a downward fluctuation in price. The reading indicates that volatility will be high shortly if the reading is reasonably low.
Standard deviation is among the most common methods of finding the magnitude of risk involved in an investment. If the SD is high, it happens when there are wild price fluctuations. Therefore, under the circumstances, it’s not advisable to invest. And low standard deviation indicates low risk in investment.
Using standard deviation in finance and forex
The SD is used, particularly in financial markets, to measure the extent of volatility. Thus, it’s a measure of risk.
Note that volatility in this context has diverse connotations. We’ll discuss the notion of market volatility and how it is described here.
How to measure expectations?
You can use the present value of SD to determine the importance of a change and set expectations. Under the circumstances, you assume that the price variations are distributed normally. Chartists can use guidelines on normal distribution to estimate price movement significance.
Regarding the normal distribution, 68% of the values are within one SD., 95% are within 2, and 99.7% are within three.
Taking the help of these guidelines, trades determine the importance of a movement of the price. A move with more than one SD will indicate more than average weakness or strength per the movement’s direction.
The chart depicts Microsoft’s 21-day SD in the window indicator. Usually, a month will have 21 business days, and a month’s SD was 88 at the close of the day. Normal distribution will have 68% observations, a change of 88 cents, and values to the extent of 95% show a change price below 1.76 cents. 99.7% values would reflect a price deviation below 2.64, equivalent to three SDs price deviations with 3, 2, or 1 as SDs are significant.
The SD for 21 days is very unstable as it deviated between 0.32 to 0.88 from the middle of August to the center of December. A moving average of 250 days is worth considering to smoothen the index and estimate the average. It approximates 68 cents. Variations in price over 68 cents were over the 250-day standard moving average of 21-day SD. These variations, more significant than the average price, imply that increased interest could trigger a change in trend or indicate a breakout.
How to rule out high volatility?
The SD indicator is frequently used in scans to rule out volatility in securities. The scan is simple and looks for S&P stocks (600). These select stocks are in an upward movement. The final stage scan clause removes stocks that experience high volatility from the results. Under the circumstances, the SD is changed into a percentage point. This will help make the comparison straightforward because all the values are on the same scale.
SD and Sharp charts
The SD can be used with SharpCharts along with parameter 10. The parameter could be modified as per the needs of the analysis. One month has 21 business days; 63 days make a quarter, and 250 business days make a year. The SD can be applied to monthly or weekly charts. You can use the indicators to SD by just clicking the advanced options. Add an overlay, and you’re done.
Why is studying volatility so important?
Fund managers have the great pleasure of observing the trends in volatility in the market. Thus, they will be interested in SD as a yardstick to compare diverse groups of funds and their continuously compounded returns over time.
In comparing managed funds, the most widely used measure is the Sharpe ratio, developed by William F. Sharpe. The Sharpe ratio is the difference between the returns on investments divided by the standard deviation being considered. This version of the investing indicator enables pension funds to compare diverse mutual funds by suitably considering the risk. Even long-term investors take volatility into account. It is a helpful indicator to help determine expectations of the way losses may go against you over the lifetime of the investment.
As for forex trading, how broadly prices vary from the average price over time is beneficial for various reasons.
The Sharpe ratio can apprise traders on how far or near to place stop-loss, or it can provide clues on if prices are going away from the range or going to move in the direction as that of a recent mean. If the SD for a currency pair is high, values corresponding to price are scattered, and the price range is wide. Thus, the SD is an indicator that shows how volatile the market is.
How do forex traders use volatility and deviation?
For forex traders, volatility brings dual scenarios. This is because when volatility is high, it brings the potential for profit. However, there is an equally higher risk: prices moving to a level, not in your favor. The amount of volatility you wish to experience depends on your trading style. Thus, a swing trader looks for more volatility in markets because when the price fluctuation is steeper, it leads to more profits within a shorter period.
Traders who use a long-term-follow strategy would like to accept a less volatile instrument as the noise of fluctuation in price makes it difficult to recognize the trend. It can also make the ride less smooth in holding a position.
Now the question is how to calculate the standard deviation.
Conclusion
If you’re looking for a simple, easy-to-understand use, the moving average deviation indicator, commonly known as the standard deviation discussed so far, is the best option for quantifying volatility. It is used in MT5 and MT4. It uses proven theory to estimate the values and enables you to check the volatility trend quickly.
As a measure of volatility, standard deviation/ moving standard deviation is an important concept. The SD offer values that help chartists bring insights into the market trends in price variation. When the price moves are higher than SD, it shows more than average weakness or strength. Further, the SD is also used with indicators like Bollinger Bands. These bands comprise two standard deviations more and less than a moving average. Moves that are greater than the bars are considered necessary and worth attention. The SD has to be used with other tools, such as chart patterns or momentum oscillators, just like the other averages.

He is an expert in financial niche, long-term trading, and weekly technical levels.
The primary field of Igor's research is the application of machine learning in algorithmic trading.
Education: Computer Engineering and Ph.D. in machine learning.
Igor regularly publishes trading-related videos on the Fxigor Youtube channel.
To contact Igor write on:
igor@forex.in.rs
