Moving average is the most used indicator in trading and represents the arithmetic mean of a given set of prices over a specific number of days in the past. For example, moving average 100 on a daily chart will draw a line of average price for the last 100 days.
The most important moving average in the trading industry is 200 Day Moving Average or 200 MA.
What is the 200 Day Moving Average
The 200-day moving average or 200 MA represents an indicator on the trading chart calculated as the average closed price over the past 200 days. The 200 MA is the most followed indicator that identifies long-term trends, potential support, or resistance areas.


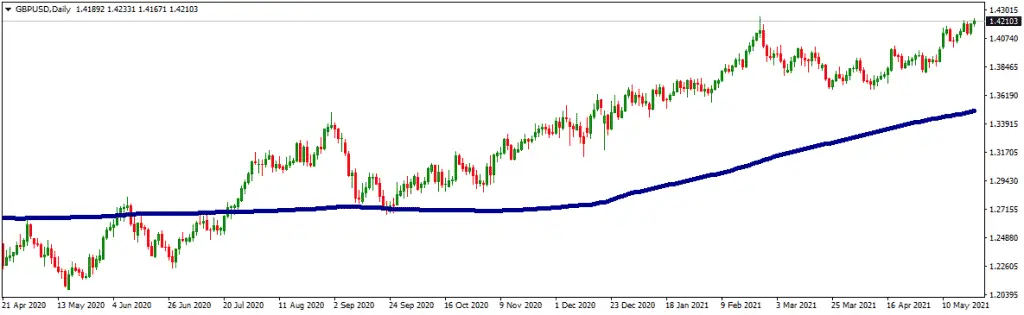


To understand the 200 Day Moving Average in simple terms, all you have to know is that it can be applied to every security, and it gives you the average closing price in the market for the last 200 days. This indicator is best used to understand and identify the trends which go on for the long term. The very reason why several people in the forex market use it is that it is considered a reliable and good indicator if one has to decide to invest in the long-term trend.
Identifying whether a market has an upward trend or a downward trend can be easily ascertained using this technical tool. If the price in a market has consistently been trading over the 200 Day Moving Average, it can well be considered as an upward trending market, while if the price has been below the 200 Day Moving Average, it is a downtrend market.
Having learned the advantages of using the 200 Day Moving Average technical indicator, we must also learn how it is calculated.
Where to find a 200-day moving average?
To find a 200-day moving average on the MT4 or MT5 platform, you need to open a daily chart and choose an indicator in the section Indicators/Trend/Moving average and then set the period to be 200.

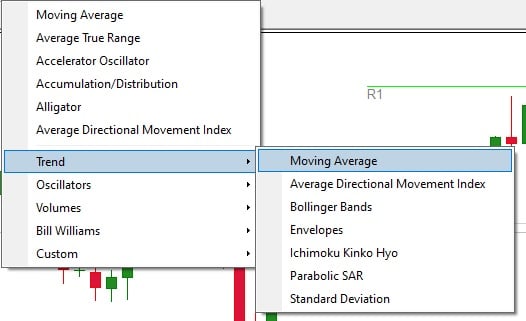
How to find Moving average indicator in MT4
How to set a 200-day moving average in Tradingview?
To set a 200-day moving average, go to the Tradingview chart; from the upper bar, press the “fx” icon and type “moving average.” Choose the Moving average indicator from the list and set the period to be 200.
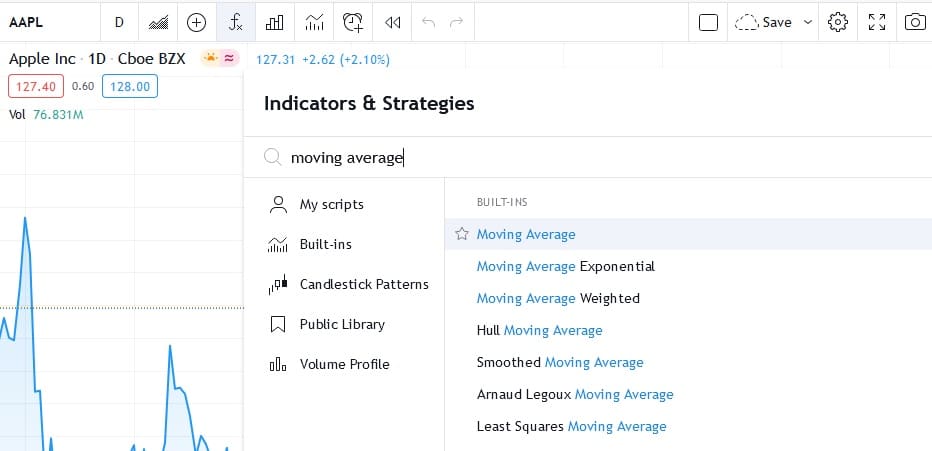
How to add Moving average to Tradingview chart
How to calculate 200-day moving average?
To calculate 200-day moving average manual, you need to sum closing prices for each of the last 200 days and then dividing by 200.
Going by simple logic, all you have to do to calculate the 200 Day Moving Average is to add up the closing price of the last 200 days and divide the figure by 200 to get the average. The figures can simply be putting in the details in the Moving Average formula.
To observe this trend on the charts, all you are required to do is connect the data points created by each day, resulting in a continuous line that can simplify the process of observation.
It is no good knowing a trading tool without understanding its applicability and usage. So, let us now understand how can this technical tool be employed in trading.
How To Apply the 200 Day Moving Average While Trading?
The 200 Day Moving Average is a popular strategy mainly owing to its wide and easy usage in assisting the traders. Two major ways of employing the 200 Day Moving Average while trading is using the 200 Day Moving Average as support and resistance or using it as a trend filter.
1. Employing 200 Day Moving Average as Support and Resistance
Generally, the trend in a forex market is in sync with the existing trend that can be ascertained by looking at the 200 Day Moving Average. It can certainly aid in identifying the key levels in the forex market that have been prevalent before, thereby becoming a dynamic support or resistance measure.
Traders generally tend to go for a long run when the prices in the market are above the 200 Day Moving Average which signifies an upward trend. While, on the contrary, they look out for shorter entries when the price in the market bounces below the 200 Day Moving Average indicating a downward trend in the market. The best place to place a stop is below the 200 Day mOving Average in an uptrend and above the 200 Day Moving Average in a downtrend in the market.
Further, when a long trend is observed in the market, the next step for the traders is to ascertain the strength of that trend. If the trend doesn’t appear strong enough, then there can be a reversal in the trend, altering the exit point in the trend by cutting it down to the present. Another way to conquer the game here is to look at the short-term trend, say a 100 Day Moving Average since it will notice the current changes in the market to clear notice, thereby providing timely indications whenever a quick move is required. This way can surely come to your rescue whenever you sense some uncertainties in the ongoing market trend.
2. Employing 200 Day Moving Average as a Trend Filter
Another straightforward way of employing the 200 Day Moving Average is by viewing the market about the line of 200 Day Moving Average. This is how a lot of traders generally decide on investing. All that is required is to view the current scenario concerning this technical tool and look for places where there is a potential of investing in the long-term trend.
If you observe that the market has been trading over the 200 Day Moving Average for a significant time, the market is trending upwards, making the traders invest in a long-term trend. This tool can also be beneficial in signaling the right time to make an exit or invest in a short-term trend.
Having understood how 200 Day Moving Trend can be employed, calculating it, and its types, let us conclude our learning in a few pointers to aid you in carrying forward the knowledge earned.
- A 200 Day Moving Average is a technical analysis tool used to ascertain the long-term trend in a forex market.
- Since a huge number of people employ this trend, it is often considered a self-fulfilling trend.
- This tend is used by traders to observe the market trend compared to the 200 Day Moving Average and make a long-term trade investment and decide on the exit points.
Lately, we would provide you with certain tips to aid you while you trade in the forex market.
- Even though the 200 Day Moving Average is an excellent indicator used by many people, there are other technical indicators that you must study and employ alongside for the best experience.
- Even though using these trends can aid a trader in the forex market, it is imperative to understand the functioning of the forex market because the trends can work the other way round as well if not understood properly.
- Moving average indicators are essentially there to help in identifying the trend. Other indicators can be checked out for the same purpose: the Average Direction Index and Ichimoku Cloud.

He is an expert in financial niche, long-term trading, and weekly technical levels.
The primary field of Igor's research is the application of machine learning in algorithmic trading.
Education: Computer Engineering and Ph.D. in machine learning.
Igor regularly publishes trading-related videos on the Fxigor Youtube channel.
To contact Igor write on:
igor@forex.in.rs
Related posts:
- Volume Weighted Moving Average Indicator
- Download Zero Lag Hull Moving Average with Arrows
- Moving Average High Low Indicator- Download Moving Average Channel Indicator MT4!
- Hull Moving Average Best Settings! – Hull Moving Average Strategy Example!
- Smoothed Moving Average vs. Simple Moving Average
- Two Period Moving Average
- What is Moving Average?
- What is the Best Moving Average for Volume Chart?
- How to Add Moving Average to RSI in TradingView? – Steps and Video
- Moving Average Deviation Indicator
- The Best Moving Average for 5 Min Chart – Case Study with Video
- Forex Weekly Strategy Based on 200 Moving Average
