Table of Contents
TradingView is a great website to solve all your problems of creating charts, coding, ass moving averages on RSI with straightforward functionality and simple usage. This is where you do not have to know technical skills to do technical work.
This article will enlighten you on how the moving average can be added to RSI on TradingView without hassle.


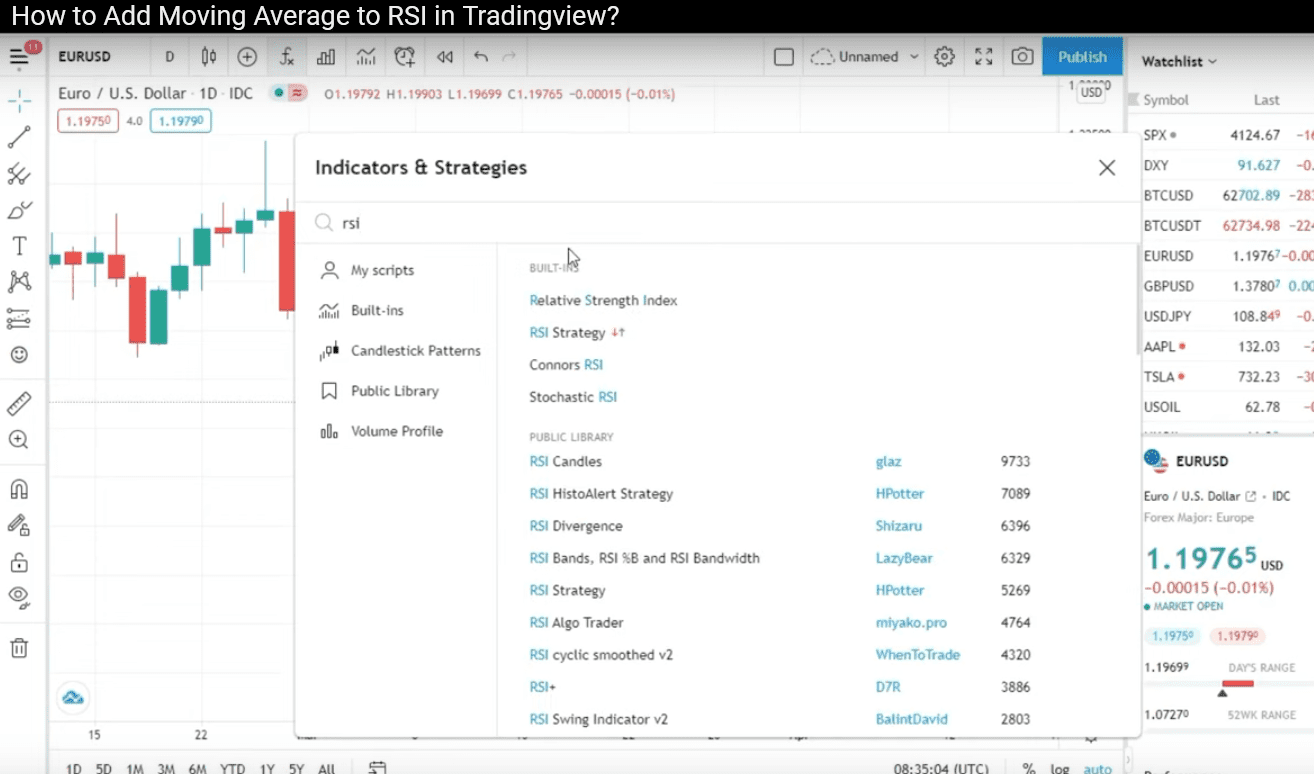
Add TradingView RSI on the chart.
- Go to Charts
- Click on add indicators
- Add on RSI that is normal
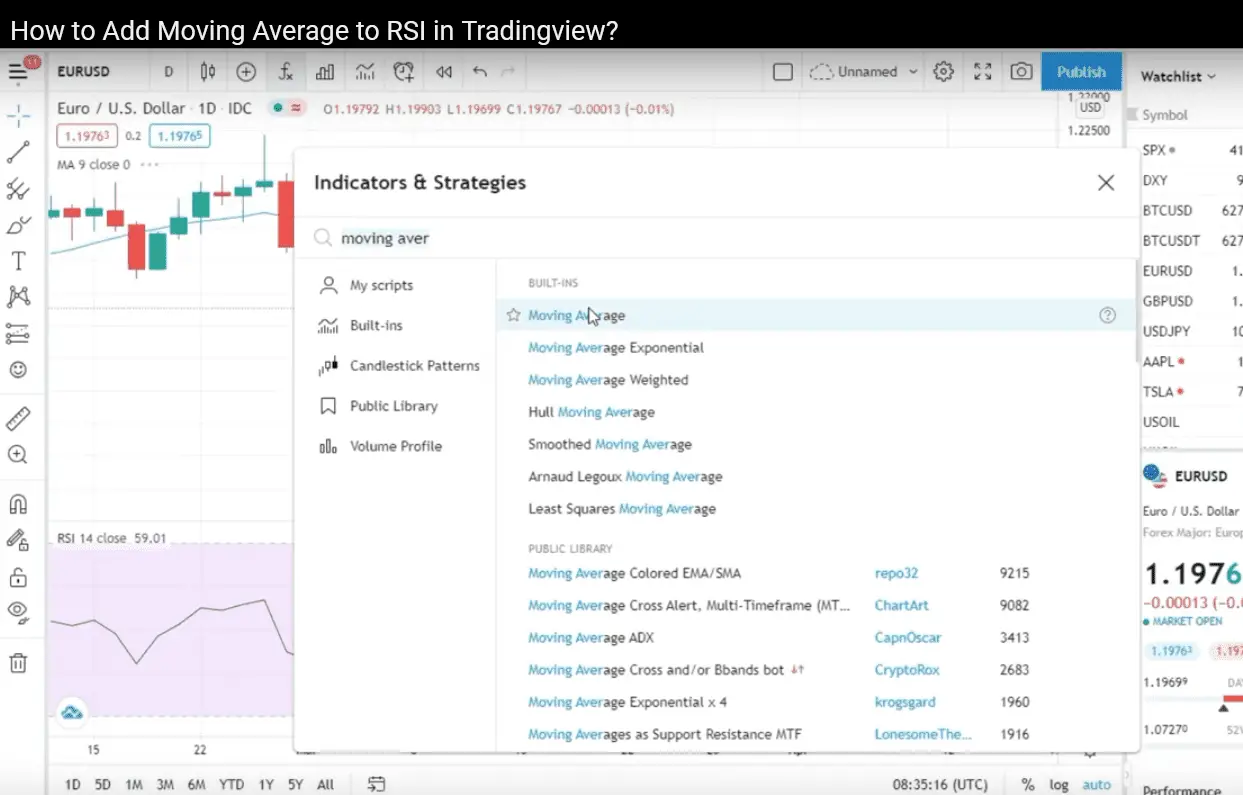
- Further, add up the moving average as normal
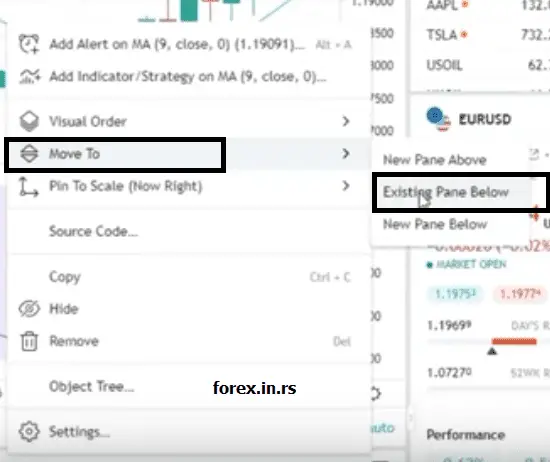
- Click the right button on Moving average on the chart
- Come down to the option of Moving to
- Choose the option of Existing Pane below
After following this procedure, your work will be done!
You can now go ahead to alter the settings of the RSI and the Moving Average if you did not do it earlier. Ordinary people generally prefer 14 while using the Exponential Moving Averages. If you like, you also have the option of adding more indicators to the RSI.
How to Add Moving Average to the RSI in TradingView?
To add Moving Average to your RSI indicator in TradingView, you need to do the following steps:
- Go to Charts
- Click on add indicators
- Add on RSI on the chart
- Add Moving average on the chart as usual.
- Click the right button on Moving average on the chart
- Choose the option “Move to.”
- Select option “Existing Pane below.”
See the video on how to add a moving average to RSI in TradingView:

How to Add Moving Average to the RSI Indicator in TradingView video
How to Add Moving Average to RSI in TradingView Screenshots:
Add RSI in TradingView (choose Fx icon):
In the next step, add Moving Average in TradingView:
Select Moving Average with the right Mouse click and choose “Move to” and then “Existing Pane below”:
Things To Know About RSI in TradingView
Relative Strength Index, also referred to as RSI, is an oscillator indicator that helps measure the change and speed of directional movements in the price. It enables you to understand the weaknesses and strengths in the present and gives you an honest look at the past. The way to ascertain it is by using the closing prices of your duration and the timeframe being considered. It helps a person show the costs and confirm the option. This indicator’s only drawback is that it might lag since the estimations are based on closing prices.
Indicators To Be Used in TradingView
Just like RSI, there are several others that you can use to ascertain different things. Some of these indicators are paid, while others are free to use. It would be best to use free indicators to start your journey and become well-versed with the system first. Eventually, you can work with a Pro+ or even a premium account at best if needed. While using essential tools like RSI, you can always add other assistance tools to make your functioning more accessible and appropriate.
There is also an option of using Indicators on other indicators to ease the functioning. For example, it is possible to use another indicator over RSI, such as the Divergence Indicator. Using multiple indicators would aid you in reaching more and better confirmations. Another example of two tools that go hand in hand is the 13/62 crossover and Exponential Moving Average. There, in fact, can be found indicators that alert you to buy and sell while you are using TradingView.
Add 50-Day Moving Average in TradingView.
Various Moving Averages can be used, among which 50-day is one. It can be best used along with TNT Strategy. The best way to work on the Bollinger Bands is to add them to the main chart and differentiate them. To make the process of adding 50 Day Moving Average to the Tradingview charts, here are some simple steps that you must follow:
- First, go to the Daily Chart section.
- Now, look for the option of adding indicators
- Feed Moving Average in the search option
- Now press on the Moving Average
- You must now click the right button on Moving Average in the charts
- Go down to the option of settings at the bottom
- Alter the length to 50 under the section of Inputs
- Press okay
And here you go! Following this easy procedure could feed the 50-day moving average option. There is also an option to get the 50-day moving average on the 4- and 1-hour categories. The simple way to go about it is to break down the candles to the per day number and multiply it by 50. Once you go through the process, you will realize how easy it is.
The most found usage of this indicator is to take benefit of the early entry. While in a new paradigm, you must begin the trade on 1M or max a 5M chart. Let us guide you through some mathematical calculations now to simplify the process for you further.
The moving average of 4-hour and 50-day: Considering a chart of 4 hours, six candles can be equated to one day. Then, to take the 50-day moving average on a 4-hour chart, you must take six and have it multiplied by 50.
50 X 6 = 300
Therefore, to get a 50-day moving average for a 4-hour chart, you must enter the length as 300
The moving average of 1-hour and 50-day: If you estimate, on a 1-hour chart, 24 candles would be equated to one day. Therefore, to get the 50-day moving average of a 1-hour chart, all you have to do is multiply 24 with 50. The calculation would look like this:
50 X 24 = 1200
Therefore, for a 1-hour chart, you must enter the length as 1200.
There also rests an option to skip the mathematical calculations and get the moving averages according to any time frame you choose by signing up for the free membership, which would also provide you with other free indicators.
RSI and moving average crossover in TradingView
- Go to Charts
- Click on add indicators
- Add on RSI on the chart
- Add Moving average on the chart as usual—set Period, for example, 50.
- Add another Moving average on the chart as usual—set Period, for example, 100.
- Click the right button on Moving average 50 on the chart and select the “Move to” option “Existing Pane below. ”
- Click the right button on Moving average 1000 on the chart and select the “Move to” option “Existing Pane below. “
RSI is a very easy-to-use platform where you can work with various indicators to ease your work. However, one strategy that works at all times would be the crossover strategy. Even though using RSI indicators is not so difficult, people might stick to using more accessible tools initially, for which this strategy can work the best.
The standard setting of RSI is set at 14; however, as time passes, you get acquainted with the Daily charts and might want to experiment with new things that work best for you. You might also research the latest techniques to find the best one that suits your needs.
Trend Trading in RSI: Like all the moving average strategies, this is yet another strategy. It works by using a pair to trend down and up with. The basic logic is that there is a requirement to have higher highs and lows against a downtrend, whereas the requirement is for lower lows and highs for an uptrend. It is possible to have taken only in the direction of the ongoing trend. Therefore, there are sales when there is a common trend and buying when there is an uptrend.
To understand this better, we can use an example of a 1-hour time frame with the RSI fixated at 21 and a moving average of 13. We would further make use of the Bollinger Bands set at 50. When it goes down to the middle line, you can move the stop loss to profit or even to a break-even point, if nothing else. Moving on, you have two options when the trend moves to the upper line or the lower line. You can either take the stop loss further into profits, close a half lot, or even close out everything. Another option is to move the stop loss after another 10-20 pips into profit if you like. There are a lot of trading techniques that can be followed. Mostly, all the traders follow a similar entry technique but meet very different ends in their varied exit techniques.
We will now list out specific entry and exit points for you to refer to:
Entry Example:
- At an RSI over 60, sell, and with an RSI below 40, buy
- When you see the RSI getting at a range over 60 and pulling over the moving average, you must make an entry on the next candle close in the right direction.
- It would help if you fixated the stop loss to the final preceding high or low, which in the current case might be 15 pips. The same can be set at 30 pips if you consider a 1-hour chart.
Exit example:
- When you find the trend getting to Basis, 50 moving average, you must alter the stop loss to gather profits.
- When the trend reaches low or high, you can alter SL to look for more profit, partial or complete close depending on your choice.
There isn’t any right way of trading. First, however, you must ensure that you are taking enough demos and backtesting. Then, you can try out the different indicators at your disposal to observe the trends and get a high hit.
There are different indicators and filters available on TradingView. However, only a few of them can be availed for free, followed by which you must enroll for packages and upgrades.
Another thing related to setting a basic RSI might trouble you, and therefore, we would finally lay down the steps to set up an RSI easily on TradingView.
- Firstly you must right-click on the option of indicators
- Locate RSI and right-click on it to add it to your cart
- Press the icon which denotes ‘settings.’
- Alter it to whatever you like by removing the default 14
Conclusion
RSI is a straightforward indicator to use and understand. You can also use this indicator flexibly with many other strategies and tools without hassle. If you are looking for a quick-fire, you must set up the RSI either higher than 80 or lower than 20. It will be a win if you post that you witness divergence on the RSI considering price actions. Divergence generally works well with RSI.
The best part is that you can access this strategy without paying anything by simply signing up for the account of Free TradingView. You can get extraordinary deals here if you upgrade in the future to a paid plan or even if you decide to work with a similar free plan.
You can have an excellent experience using the free plans offered by TradingView. It will be a very safe choice when you are unsure of the strategies you want to use and master. The free sign-up can help you experience the best without losing out on anything significant in the beginning.
The best way to upgrade the account is by reinvesting the money you make via trading for free. However, after you have earned some money, it may be an excellent choice to invest in standing a higher chance of making money by upgrading to a premium plan.
TradingView can offer good deals after signing up for free for 30 days and around Black Friday. Therefore, you must wait patiently for these deals to arrive and make money out of free sign-ups till then to have the best experience.

He is an expert in financial niche, long-term trading, and weekly technical levels.
The primary field of Igor's research is the application of machine learning in algorithmic trading.
Education: Computer Engineering and Ph.D. in machine learning.
Igor regularly publishes trading-related videos on the Fxigor Youtube channel.
To contact Igor write on:
igor@forex.in.rs
