Table of Contents
We’ll look at volume-based moving averages, which traders can use to help identify trend strength and changes in volume.
Moving averages for volume are less common than price. Moving averages are used to identify trend strength and changes in volume, but you can also combine them with other indicators to help you predict changes in the market.


What is Volume Moving Average?
The volume moving average or VMA represents a line created from some of the closing prices of a security over a specific number of periods applied on the Volume chart. So, instead of putting a moving average line on the main price chart, we can put the moving average line indicator on the Volume chart.


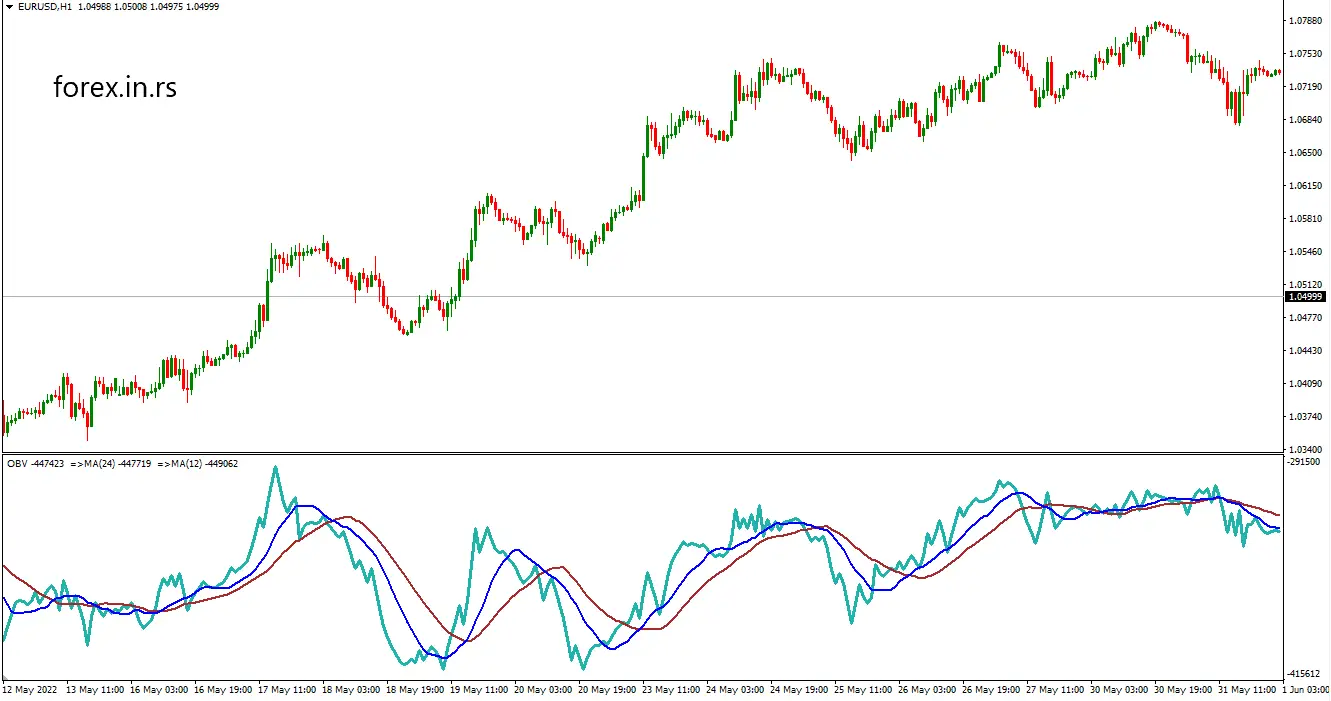
Moving averages (red and blue line) on OBV Volume chart
A simple moving average is calculated by adding all the closing prices for a given period and dividing that total by the number of days in that period. For example, if you have ten days’ worth of closing prices and your MA is $2, your MA is 2 dollars ($2/10 = 0.20). The next day’s closing price will then be added to your previous day’s close while ignoring any new information or price movement that might not have been reflected at that specific time (again, ignoring any issues with trading hours). Because this lag effect on each day’s closing price is added together over time instead of being included in real-time like a simple moving average (SMA). It may confuse which should be used more often when analyzing market activity patterns: SMA or EMA? To answer this question, let’s look at what happens when we compare both types side-by-side using historical data from several markets around the world using something called “exponential smoothing.”

As a trader, you know that price and volume are both critical. However, many traders overlook volume entirely or only pay attention to it in-between major events like earnings reports or buyouts.
The truth is that volume is one of the critical components of technical analysis and should be considered alongside price when evaluating stocks. Volume tells us how many shares are traded at any given time, which helps provide context for what’s happening with prices. For example: if there’s high trading activity but low prices, buyers are probably winning out over sellers (and vice versa).
What is the Best Moving Average for Volume Chart?
The best moving average for M30, H1, and H4 volume charts are 12 MA, 24 MA, and 36 MA, while for higher time frames such as Daily, Weekly, or Monthly, you can use MA10, MA50, MA100, and MA 200.
Usually, professional traders use the last 12 hours moving average, last 24 hours moving average, etc., for short-time trades. In contrast, when they trade on Daily charts or higher, they calculate several days, such as 10 days, 20 days, 30 days (month), and 200 days. So, this conclusion is not related to performance but hours/days measurement logic.
One of the fastest moving averages for the daily chart is 10 MAV.
Let’s take a look at what this means in one example:
- If you see that prices are rising and the 10-day MAV (moving average for volume) also shows an increase, it indicates that there has been more buying than selling pressure over those ten days. This means that investors are interested in your stock, which suggests future growth and possibly even an increase in value.
- Suppose you see prices declining, but the 10-day MAV has remained flat or slightly increased over those ten days. In that case, this indicates that there has been more appreciation than depreciation among investors during that period. It means they’re still generally bullish on your company’s prospects despite any temporary dips in its performance or value due to external factors (like competitors being late to market with new products).
- Finally, suppose prices and volumes decline simultaneously over each other’s respective time frames (as measured by MAVs). In that case, it could be a sign of impending doom- perhaps something happened recently causing everyone involved to lose faith at once suddenly- and thus should probably sell off their shares right away! You wouldn’t want any part of such an illiquid situation given how volatile it might become before things stabilize again.”
Another option is the EMA (Exponential Moving Average).
It reacts faster to recent price changes than a simple moving average. Because of this, EMA can be used to emphasize the most recent prices in a price series, which can help you decide where to place your stop-loss order, for example.
Some traders also prefer to look at the Bollinger Band Volume indicator to see if a stock is overbought or oversold based on its relationship with the upper or lower band. When the volume is above the upper band, there is excess demand for the stock. And when the volume is below the lower band, it means there is an excess stock supply.
Conclusion
Volume moving averages can help you identify trends and changes in volume that may signal a price change. Volume is a good indicator of trend strength. If the trading volume increases, it can mean that buyers are more interested in a particular security or options contract. The price will also probably rise because there’s more demand for it and less supply on the market.
In addition to using volume moving averages to help you identify trends, you can also use them to identify changes in volume. For example, suppose the market has been upward but has lower than average daily trading volume for three days in a row. This could indicate that the prevailing trend will reverse itself because traders aren’t buying as much anymore, looking to sell instead.

He is an expert in financial niche, long-term trading, and weekly technical levels.
The primary field of Igor's research is the application of machine learning in algorithmic trading.
Education: Computer Engineering and Ph.D. in machine learning.
Igor regularly publishes trading-related videos on the Fxigor Youtube channel.
To contact Igor write on:
igor@forex.in.rs
Related posts:
- Volume Weighted Moving Average Indicator
- The Best Moving Average for 5 Min Chart – Case Study with Video
- Two Period Moving Average
- What is Moving Average?
- Smoothed Moving Average vs. Simple Moving Average
- Moving Average High Low Indicator- Download Moving Average Channel Indicator MT4!
- Hull Moving Average Best Settings! – Hull Moving Average Strategy Example!
- Download Zero Lag Hull Moving Average with Arrows
- What is the 200 Day Moving Average or 200 MA?
- How to Add Moving Average to RSI in TradingView? – Steps and Video
- Moving Average Deviation Indicator
- Volume Weighted Average Price VWAP Strategy – VWAP indicator for Nifty
