The two-period moving average (MA) is indicator traders use to determine when to buy or sell stocks.
A two-period moving average helps traders determine whether they should buy or sell stocks based on their move relative to a chosen benchmark. If the price is above the moving average, it may be time to buy; if below, sell. The length of time used depends on what kind of trading strategy you are using. For example, if you are using daily charts with weekly MAs, you’ll want to use data from 6 months ago until today’s date (or longer if you like). If using weekly charts on monthly data, then use data from 3 months ago until today’s date (or longer if you like).
What is the two-period moving average?
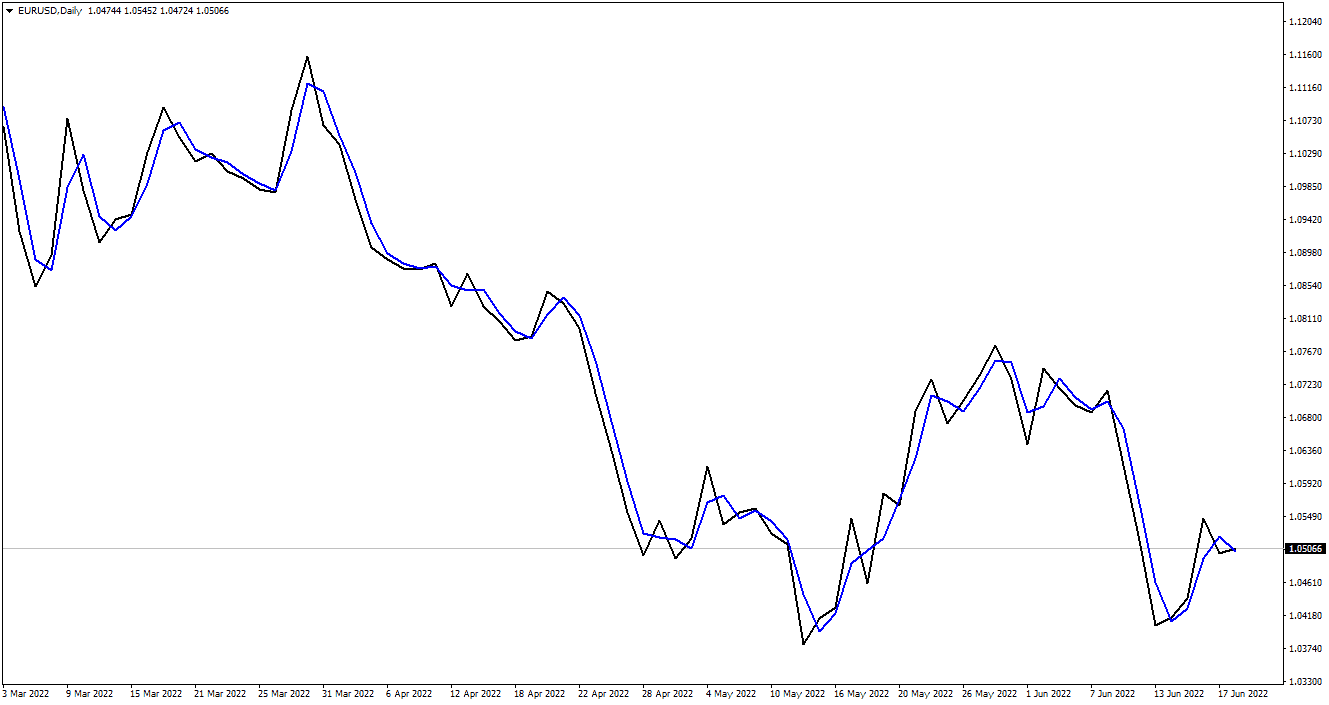
The two-periods moving average represents a simple moving average of two last prices. For example, if yesterday’s close was 1.302 and today’s closed price is 1.304, the two-period moving average will be 1.303. In technical analysis, this moving average almost matches the line chart and does not have a large implementation.


A technical analysis technique for stock trading is the two-period moving average. It is used for generating buy and sell signals for your trades. The moving average is a trend-following indicator, which will always follow the current price movement. The moving average is used to generate buy-and-sell signals for your trades, which can be seen as a lagging indicator.
How to calculate a two-period moving average?
The two-period moving average is calculated in the following way:
- Add today’s closing price and yesterday’s closing price.
- Divide the total by two (this is called the “moving average”)
The two-period moving average is calculated by adding today’s closing and yesterday’s closing prices and dividing the total by two. This formula can calculate a 2-period moving average or an n-period moving average.
For example: If the current stock price is $100 and the previous close was $100, then your two-day (2) simple moving average would be 100 + 100 / 2 = $100.

Similarly, the N period moving average is calculated by adding the closing price of each of the last N days and then dividing by N. The most recent days are given more weight than older days. The value of N is usually less than 20 and generally more than 5. It can be any positive integer.
Let’s say you are looking at a chart Inc. (TSLA) from January 1, 2012, through September 8, 2019. You notice that the price has been in a downtrend for the past year and has recently broken below its 2-day moving average.
You decide to wait for TSLA to break above its 2-day moving average before buying shares because you believe this will mark an opportune time to buy low and sell high. However, if you were using two-period moving averages in your analysis, you would not have needed to wait until TSLA broke above its 2-day MA before buying shares. It’s because TWMAs are quicker indicators than MAs and can signal reversal, even when MAs have yet to signal them!
The Two Period Moving Average is a technical analysis tool that can be used to generate buy-and-sell signals for stock trading. It is calculated by adding today’s closing price and yesterday’s closing price, then dividing the sum by two.
The two-period moving average (2-period SMA) is essential for technical analysis, especially for traders who want to use moving averages as part of their stock trading strategy. A moving average line indicates how fast or slows a stock has been moving over time; it’s an average line that shows investors what prices have been over previous periods of time on any given chart or graph.
In order to calculate this indicator, you first need to find out what time period works well with your investment goal and risk tolerance level. The more volatile your investment portfolio is (meaning riskier), then you would want something like a 5-day moving average versus, say, an 8-day one because this will help smooth out some of those volatility points while still giving enough information regarding where things stand now relative compared against previous periods such as weekdays Monday through Friday, etc.
Conclusion
In other words, the two-period moving average is calculated by adding today’s closing and yesterday’s closing prices and dividing the total by two. So if today’s closing price is $100 and yesterday’s closing price was $99, then your 2-day moving average would be 100 + 99 / 2 = 100.50, or $100 per share.
The N period moving average is calculated by adding the closing prices of each of the last N days and then dividing by N: If you have five days’ worth of data (i.e., yesterday through today), then you would add up all five days’ worth of prices (e.g., 1 + 2 + 3…+ 5) and divide that number by five – that gives us our 5-day simple moving average (SMA).
You can also calculate an exponential moving average for your stocks or ETFs. An exponential moving average is similar to a simple moving average but t more weight (importance) on recent prices than older ones.
The exponential moving average is mathematically more complicated than the simple moving average. It’s calculated using a weighting multiplier applied to each day’s closing price and added together for each successive period. The multiplier is then multiplied by a constant (a number between 0-1) to give greater importance to recent price changes than older ones. This gives us an exponentially weighted moving average that, like its simple counterpart, smooths out short-term fluctuations in stock price movements, making them easier for investors and traders to interpret at a glance.

He is an expert in financial niche, long-term trading, and weekly technical levels.
The primary field of Igor's research is the application of machine learning in algorithmic trading.
Education: Computer Engineering and Ph.D. in machine learning.
Igor regularly publishes trading-related videos on the Fxigor Youtube channel.
To contact Igor write on:
igor@forex.in.rs
Related posts:
- Smoothed Moving Average vs. Simple Moving Average
- What is the Best Moving Average for Volume Chart?
- What is Moving Average?
- Moving Average High Low Indicator- Download Moving Average Channel Indicator MT4!
- What is the 200 Day Moving Average or 200 MA?
- Average Collection Period Interpretation
- The Best Moving Average for 5 Min Chart – Case Study with Video
- Hull Moving Average Best Settings! – Hull Moving Average Strategy Example!
- Volume Weighted Moving Average Indicator
- Moving Average Deviation Indicator
- Download Zero Lag Hull Moving Average with Arrows
- How to Add Moving Average to RSI in TradingView? – Steps and Video
