Table of Contents
A moving average is a mathematical calculation based on data points. It’s used for smoothing out short-term fluctuations in prices and identifying trends. Daily traders can also use it to identify support and resistance levels.
What is the Moving Average in trading?
Moving average represents a technical indicator that looks like the line on the chart and smooths out price data by creating a constantly updated average price. To calculate the moving averages, you must create a series of averages of different subsets of the complete data set.


A moving average is calculated by adding up all the past closing prices for a security, then dividing them by the number of days in the studied period. For example, if you were calculating the 10-day moving average for a stock that traded each day for the last ten days, you would add up all ten days’ worth of closing prices and divide them by 10. The result would represent your 10-day moving average.
You can read our text about two moving average periods to learn more about calculation.
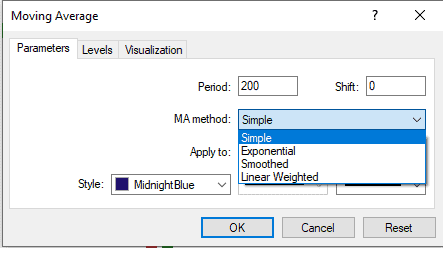
How do we change different types of moving averages in MT4?
To change the moving average type, you need to go to the MT4 chart, press the right button on the mouse and choose the “Indicator list” option. There find moving average indicator and change in input moving average type.

What is the best moving average?
The best-moving average in trading is SMA 200 on the daily chart because traders usually use this indicator as a bullish/ bearish invalidation point. The best moving average for the volume chart is MA10, MA50, MA100, and MA 200.
The best moving average for traders to determine trading cycles is TMA (triangular moving average).
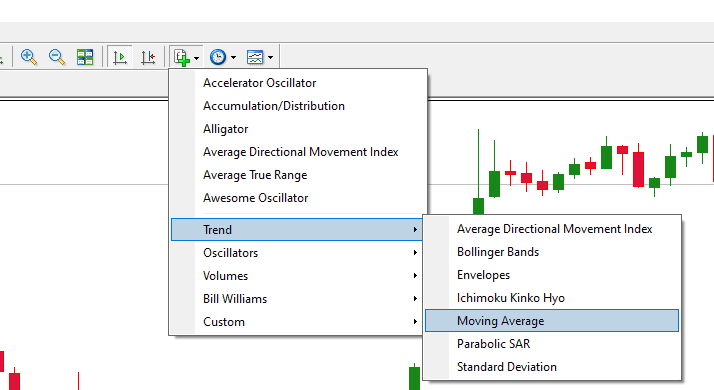
How to add a moving average to the MT4 chart?
To add a moving average to the MT4 chart, go to the “Indicators” button on the main menu, choose “Trend,” and then “Moving average.” Please see the image below:
Using TradingView, you can learn how to add moving averages to the TradingView platform.
Moving Average Types
The most common type of moving average used in trading is an exponential or exponential smoothing (EMA) method. This type of smoothing uses weights that get smaller as they get farther away from today’s price—the weighting decreases exponentially over time, so recent data has more influence than older data. The advantage to using this type of smoothing is that it’s less sense son simple arithmetic averages, so it doesn’t react as quickly when new information comes in or when there are significant price changes.
Determining the best MAs for day trading is subjective and often depends on your trading style, market conditions, and preferred indicator settings.
The best Moving Averages for day trading depend on your trading style, market conditions, and the settings of your indicator.
The most popular moving average indicators are:
- SMA—Simple Moving Average
- WMA—Weighted Moving Average (Weighted Close)
- EMA—Exponential Moving Average
- Double Exponential Moving Average (DEMA)
- Triple Exponential Moving Average (TEMA)
- Triangular Moving Average (TMA)
We recently wrote an article about Smoothed moving average. Learning the difference between Smoothed Moving Average and Simple Moving Average is important.
The Simple Moving Average (SMA)
The Simple Moving Average (SMA) is a price-weighted average of the last n number of data points, also known as candles. Each price point in the set is given an equal weighting and added together to determine the SMA. For example, if you are calculating an SMA for five days and your chart shows ten candles per day, then your 5-day simple moving average would be created by adding up all ten candles from each day and dividing them by five (10/5).
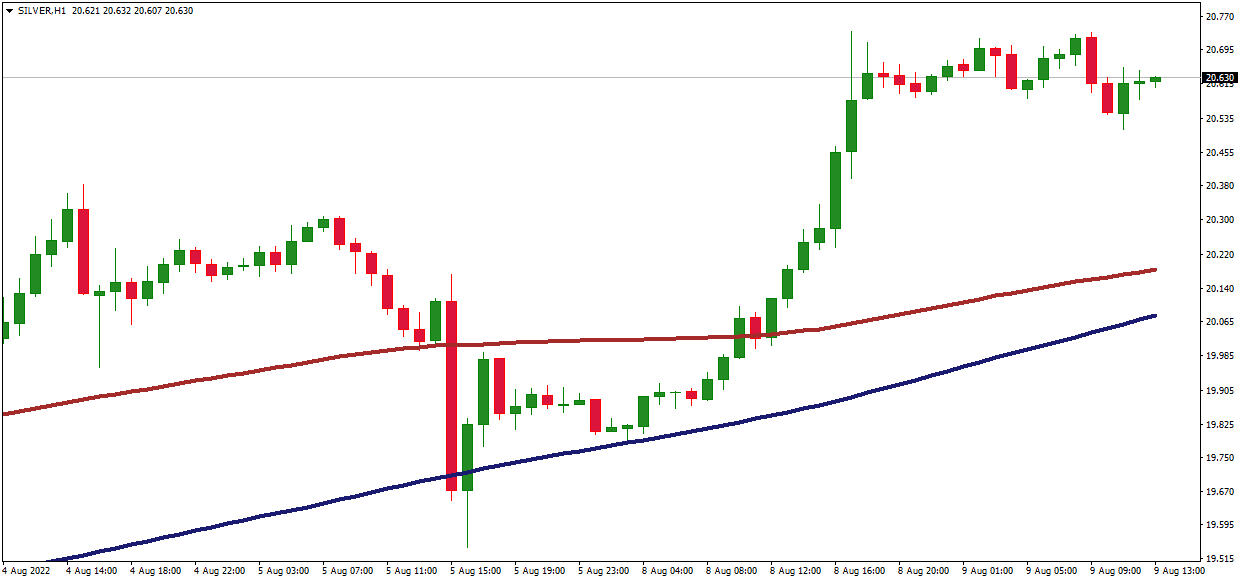
Weighted Moving Average (WMA)
The WMA is a more recent addition to the moving average family. It differs from the SMA because it gives less weight to older data than the most recent. This means there will be less lag than with an SMA but also means it’s more sensitive to fluctuations in the stock price.
The WMA is generally used for day trading, which means you’re looking for trends and patterns over a shorter period (minutes or hours).
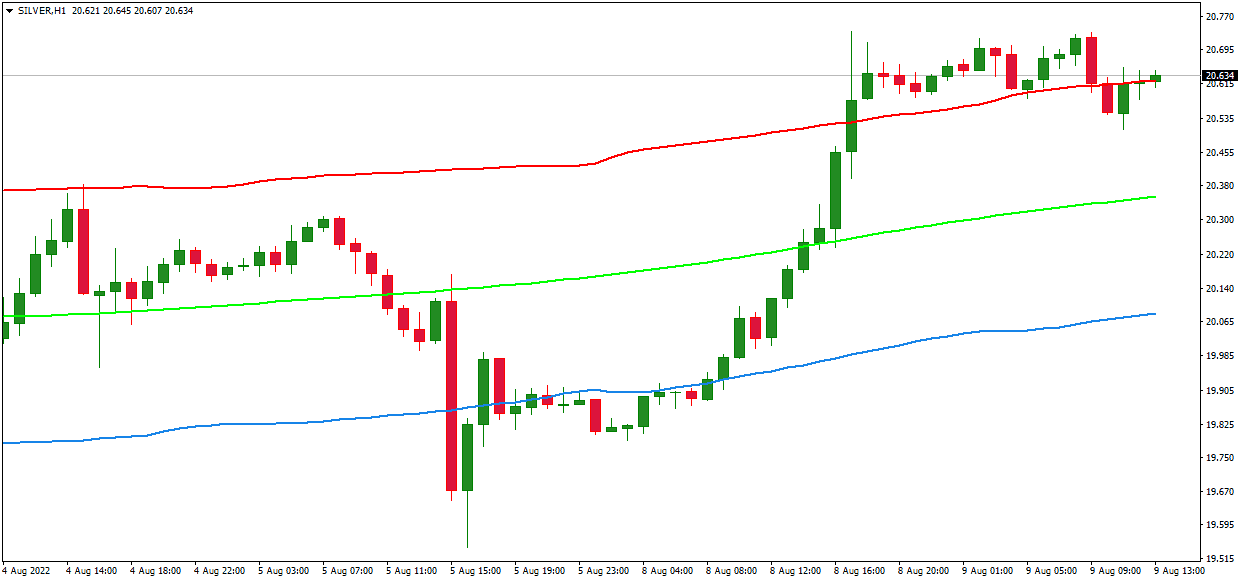
Below is presented WMA with red color while blue color is SMA:
Exponential Moving Average (EMA)
The exponential moving average (EMA) is a popular technical analysis indicator. Welles Wilder originally introduced it in his book, New Concepts in Technical Trading Systems, published in 1978. The moving averages used for this indicator are weighted and exponentially smoothed. Because the weighting scheme of the EMA increases as time passes, it has a greater emphasis on recent prices than earlier prices.
The formula for calculating an EMA goes as follows:
- Calculate a simple moving average (SMA) from n periods back from your current price.
- Multiply that value by “alpha” and add it to one; this will be your initial EMA value.
- Repeat the process above using each new period’s SMA value as input until you reach n periods (or some other predetermined number).
And now, there are some other moving averages:
Double Exponential Moving Average (DEMA)
Another popular type of moving average in trading is the Double Exponential Moving Average (DEMA). It is a type of exponential moving average that has two periods. The first period calculates the EMA, and the second period determines its value.
It approaches price action differently than other types of moving averages as it gives more weightage to values closer to their current value. This makes it a faster-moving indicator than standard EMAs but less responsive than simple exponential moving averages.
It’s less likely to be distorted by price spikes or gaps since it has more data points in calculating each value, meaning each line on the chart will move slower than an EMA or SMMA.
Triple Exponential Moving Average (TEMA)
Themeaningonential moving average is a smoothness developed to help traders identify long-term trends in their trading strategies. Traders can also use it to spot reversal points in the market and identify when a trend will reverse or change direction. Day traders do not commonly use TEMAs as they tend to lag behind other indicators such as the MACD and RSI, which are more useful for shorter periods like 5 minutes or less.
Triangular Moving Average (TMA)
The triangular moving average is an indicator that calculates the average price of a currency pair over a given period. Traders can use it to identify trend changes and make trading decisions.
Calculating TMA
The TMA is calculated by adding all previous closing prices, then dividing them by the number of periods you have selected.
For example, if you have set your time frame at 5 minutes and want to calculate the 10-period TMA, you will add all ten closing prices in those 5 minutes (for example, 1 minute = 20 bars) and divide this sum by 10 = 2 points per bar. And after each new tick appears on your chart within 5 minutes, this value will change because it adds one more point from the latest tick’s value in its calculation formula. Therefore, it creates an average line for every period length you’ve chosen, which tends to follow along with price movement. But it does not react immediately like other indicators do, as they wait until their calculations are complete before showing any results (which may cause some lag).
Conclusion
The best moving average that traders use is SMA 200 on the daily chart because usually, this indicator is used for overall trend prediction. If the price is below SMA200 on a daily chart, we can talk about a bearish trend, while if the price is above SMA200, it is a bullish trend.

He is an expert in financial niche, long-term trading, and weekly technical levels.
The primary field of Igor's research is the application of machine learning in algorithmic trading.
Education: Computer Engineering and Ph.D. in machine learning.
Igor regularly publishes trading-related videos on the Fxigor Youtube channel.
To contact Igor write on:
igor@forex.in.rs
