Table of Contents
As we know, a simple moving average (SMA) is a trading indicator and calculation that takes the arithmetic mean of a given set of prices over a specific number of days in the past.
What is Smoothed Moving Average?
A smoothed moving average or SMMA is a moving average that assigns a weight to the price data as the average is calculated, deals with a more extended period, and represents the combination of a simple moving average and an exponential moving average.


A smoothed moving average does not refer to a fixed period but instead collects and enrolls all available data from the past. To calculate today’s moving average, traders must subtract yesterday’s smoothed moving average from today’s price. After that, traders have to add the result to yesterday’s price.


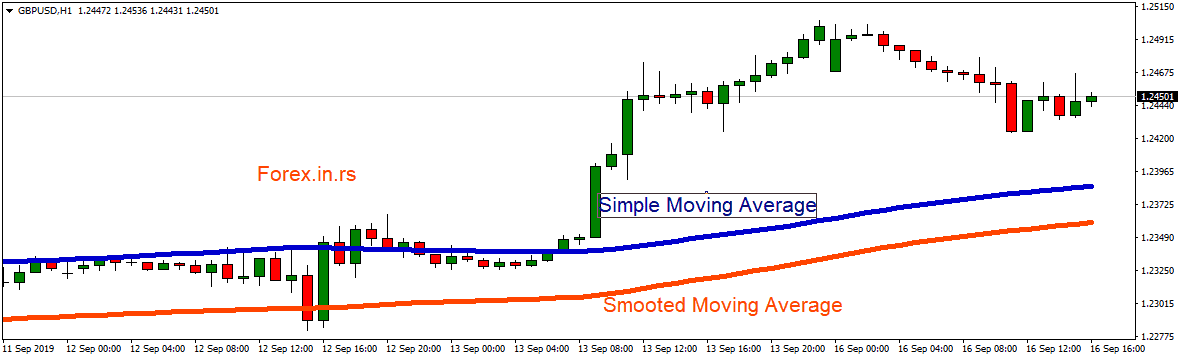
Smoothed moving average vs. Simple moving average
- Different calculation formulas because the simple moving average is computed by averaging the price over a specified period. The smoothed moving average eliminates the lag by placing more emphasis on recent prices and less stress on past prices.
- The smoothed moving average gives more impact average than the simple moving average.
- A simple moving average reacts faster on recent price changes than smoothed.
Watch Smoothed moving average video:
Properties

It smoothed the Moving Average Period. This characteristic deals with the number of bars in the chart. In daily data, the period will stand for days, whereas for months, it will denote months, and so on. The app sets a default of 9, but the period is lengthened for the user’s convenience, which allows you to view the data more accessible and create a general vision of the current price trend.
It smoothed the Moving Average Aspect. It deals with the symbol field where the data series are calculated. As you enter the app to look for a symbol in the chart, it will be set to “default,” which is identical to the “Close” symbol.
Smoothed moving average series (SMMA) calculation
The combination of a simple moving average and the exponential moving average is called a smooth moving average. The value of SMMA is approximately equal to the EMA value, with just the period double that of EMA. This smoothing technique allows analysts to reduce volatility in a series of data. Since this technique takes input from past periods, it captures the economic scenario better than non-smoothed graphs.
Some analysts take out all EMA, SMA, and SMMA and then analyze the market trends. It is always a personal choice as to how many parameters to consider.
The SMMA formula
The Smoothed Moving Average formula represents the calculation of the average as follows:
SMMA(i) = (SUM(i-1) – SMMA(i-1) INPUT(i))/N
where the first period is a simple moving average.
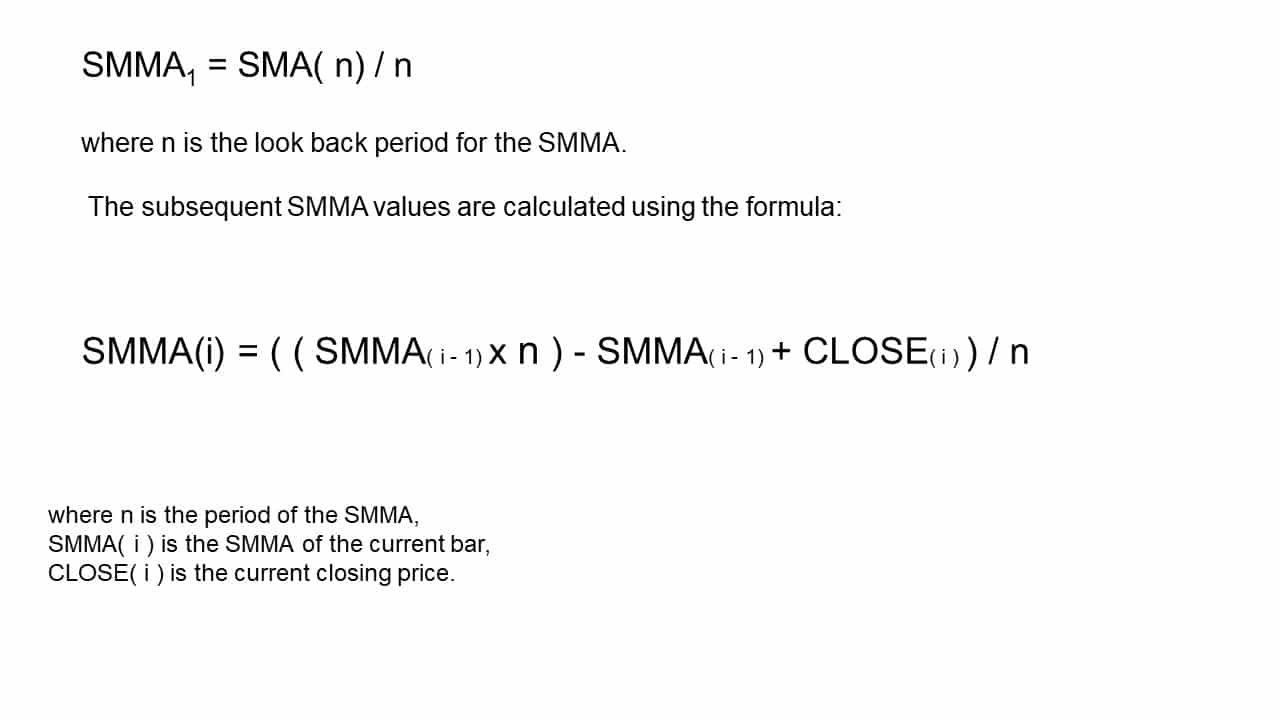
The formula to calculate the SMMA is:
SMMA = (SMMA# – SMMA* + CLOSE)/N
Where
SMMA# – Previous bar’s smoothed sum
SMMA* – Previous bar’s smoothed moving average
CLOSE – Present closing price
N – Period of smoothing
The Smoothed Moving Average, or SMMA formula, is a popular method used to calculate and analyze trends in financial data. This formula considers the price changes over time, using a weighted average to determine the overall direction.
- To use the SMMA formula, you will first need to gather historical data on the price of your asset. You can typically find this data on financial websites or in historical stock reports. Once you have your data points, you can begin calculating the SMMA value using the following steps:
- Create an array containing your historical prices and their corresponding dates. For example, if you are analyzing daily stock prices over one year, your array might look like this:
- Next, create another array that contains the number of trading days within each date range in your original array. For example:
- Now that you have your two arrays created, you can begin applying the smoothing function to calculate your final SMMA value for each date range in your original data set. To do this, you will use the following formula:
- Where SMA represents the “Simple Moving Average,” p is the previous day’s SMMA value for each date range in your original data set, and n is the total number of days in each date range (the number of trading days between each date).
- Once you’ve calculated all of your SMMA values for different periods in your original data set, you can then plot these values on a chart or graph to help analyze trends and make predictions about future price movements based on past performance. Overall, using Smoothed Moving Average formula can be a powerful tool for investors looking to gain insights into market trends and make more informed decisions regarding trading and investing activities.
A smoothed moving average differs from a simple moving average in several aspects. The most crucial difference refers to the period taken into account while calculating the average. A simple study uses only the most recent data to generate the average. Simultaneously, a smoothed study also considers data from the distant past, say a month or two months ago, which plays a role in determining a more accurate and relevant average. Still, older and new data are not assigned the same weight due to their relevance in establishing the current price. Price data collected one month ago, for example, will be given lower significance in calculating the smoothed moving average due to its negligible impact on the current price trends. Nonetheless, it is not removed from the computation process, as it fosters a long-term vision of the trading trends.
The main advantage of a smoothed moving average is that it removes short-term fluctuations and allows us to view the price trends much more accessible.
Smoothed moving averages are widely used in trending markets. You are alerted about a new buy signal when the line denotes a short-term average that crosses above the line that stands for a longer-term average. Simultaneously, a sell signal occurs when the short-term average exceeds the long-term average. Marketing technicians suggest using longer-term averages while trading with two smoothed moving average that uses the same signal.
Another approach in trading is to know how to manage the current price. You buy if you have a current price that passes over the smoothed average line. You remove the position when the current price gets below the moving average. Regarding a short position, you sell when the cost exceeds the moving average. When it rises above, you remove the position.
To become a successful trader, you should learn to tell simply from smoothed moving averages. While simple average works with a short-term period and process only new data, smoothed average promotes a longer-term study, assigning weight to old data for a clearer view of price trends.
Measuring market trends and investing in the right stock is the best way to make money; every investor accepts it. It is the sense of analyzing the movement which makes the difference.
There was a time, not very back, when people used to buy and sell stocks according to their intuitions. But now, technical analysis has taken the market. Several tools consider the historical stock price data and give predictions. This analysis has increased the probability that your decision is correct.
Any tool cannot be perfect in analyzing the trends because the market never moves in a straight line; there are variations in the market every moment one has to research, making it a tedious task. The analysts take the help of many parameters, which are listed below –
Moving averages
This analysis technique is the most trusted and widely accepted because of its versatile nature. Analysts’ more commonly used form of moving average is the 200-Day moving average. Here 200 days – the moving average is plotted on a price chart, and whether the stock price is above the moving average line or below it indicates that the stock should be sold or bought. Some analysts also consider 50 or a ten-day moving average.
There are two main types of moving averages:
Simple Moving Average
It is the most common method of taking out the average; it is taken out by adding prices and dividing it by the price data.
Let us take an example –
If the following are seven stock prices 10, 20, 30, 40, 50, 60, 70, and we want to take out the SMA, then it would be
(10 + 20 + 30 + 40 + 50 + 60 + 70) / 7 = 40
So the simple moving average of this set of data is 40.
This data will help get a clue about what might happen next in the market. It might seem a straightforward technique, but it still has to face criticism from experts; this criticism is because of the “drop-off effect.”
Here what happens is that the latest prices make a minimal impact while, on the other hand, the earliest prices sometimes make a huge impact. One needs to keep this in mind. The smoothed moving average can also be manipulated by discarding the earlier data. Any significant change in the smoothed moving average can give wrong indications, which can incur losses for the investor.
Also, some older data might be significant, and the simple moving average is not considered.
Analysts came up with the exponential moving average to eradicate these shortcomings of the simple moving average (EMA).
Exponential moving average (EMA)
It is a versatile averaging technique used by analysts. It values current prices more as compared to past prices. It makes the exponential moving average sensitive to recent price fluctuations.
The calculation of EMA also includes the previous and recent EMA values.
The formula for calculating EMA is –
EMA = EMA# + SF*[P – EMA#] where
EMA# is the previous latest EMA value
P denotes the price in that period.
SF stands for a smoothing factor.
Because of its unique calculation, EMA follows prices more closely than an SMA.
Smoothed moving average vs. Simple moving average vs. Exponential moving average
EMA value is susceptible to market trends; it can help investors take respective actions. For any investor who wishes to grasp the market trends quickly, it will be much better to use EMA than an SMA value. But one disadvantage is that if there is a sudden spike or abnormal event in the market, EMA being very sensitive and prompt to market conditions will signal the investor to quit the stock, making a loss.
On the other hand, if the investor has a long-term vision and is ready to wait and observe the market, then SMA would be the best choice because of its smoothness. If a trend is set, it usually lasts for a long time. That’s why choosing SMA, in this case, can be beneficial, but since SMA shows a considerable delay, it will ignore good entry points, and the investor might lose the opportunity to make profits.
Smoothed moving average as a combination of SMA and EMA using the smoothing technique allows the analysts to reduce volatility in a data series. Because of that, the smoothed moving average is SLOWER than the SMA.
That’s why it is said that different trading patterns require other analysis methods. One can never bank on anyone’s analytical technique; one should use simultaneous techniques to get a broader perspective since trading is all about probability. That’s why you cannot be even sure that, after so much analysis, you will achieve what you desire.
Trading is a game of chance and risks; one must devise the methods which suit them the most. Experimenting without fearing anything will be very beneficial in stock trading. The more you trade fearlessly, the more sensitive you will become toward market trends. Even after so many analysis techniques, one should always listen to its gut feelings. After a certain period in trading, people automatically develop the attitude of taking risks and start playing big, which pays them big and costs them big. A trader can get a bigger picture of the trend using a smoothed moving average.
Smoothed moving averages are a type of trend line that can help traders identify the short-term and long-term trends in the price of an asset. Smoothed moving averages are calculated by taking the average of prior closing prices and then calculating the moving average again in each subsequent period. The most common smoothed moving averages are the 5-day, 10-day, 20-day, 50-day, and 200-day.
A trader can use a smoothed moving average to identify when a trend is beginning or ending by looking for changes in slope. A steepening slope indicates that a trend has already started, while a flattening slope indicates that a movement has been completed.
In technical analysis, however, the simple moving average (SMA) is a popular indicator. By averaging the closing prices of an asset over time, it smooths out price swings. The ultimate result is a straightforward trendline.
The longer the period, the more smoothed out the line will be. This means that you should use longer-term SMA lines to see a more accurate picture of price fluctuations over weeks or months and shorter-term SMA lines to see what’s happening today or this week.
You can apply SMA to any market or instrument—stocks, bonds, currencies, and commodities like gold and oil—and it works well on intraday and daily charts.
The simple moving average is computed by adding up the last n prices and dividing by n. The resulting value is then averaged across all of the data points in your period.
It can smooth out price data and make it easier to identify trends. For example, let’s say you are tracking stock prices over one year, but every time you look at your spreadsheet, it seems so “noisy.”
You may feel overwhelmed or confused when looking at this chart—how can you tell if prices are going up or down? This is where moving averages come into play: they help smooth out these movements so that you can see a more precise trend line emerge from your noisy data.
A smoothed moving average is a weighted moving average. It places more emphasis on recent prices and less focus on past prices. The smoothed moving average is computed using two or more data sets, such as closing price and volume.
A simple moving average can be computed using only one data set (the close). This is because the simple moving average uses all previous closing prices to calculate its value. Because it includes all previous closing prices, it always lags behind price movement by one period because of its delay in calculation using only one data set (the close).
Simple and smoothed moving averages are widely used in stock market technical analysis.
Moving averages are a simple and valuable method for smoothing or filtering out price variations so that you can see the trend more clearly. The simple moving average (SMA) and its smoothed equivalent, which is typically referred to as a “smoothed” or “exponential” moving average, are the most often used moving averages.
The SMA is calculated by adding all the prior closing prices over time and dividing that total by how many days were included in your calculation. The resulting number becomes your daily average for your chosen time. If you use an SMA of 10 days, then this would mean that each day’s closing price was added together with all other days from 11-20 before being divided by 10; so on day 1, you would add today’s closing price with yesterday’s closing price (from 11-20 days ago), divide them by 2 (because there was only one day), then take 2/10th of today’s closing price as its new SMA value; repeat until you’ve reached today again at which point today becomes yesterday again and so on.
Conclusion
There are several advantages and disadvantages to using a smoothed moving average versus a simple moving average.
The most important advantage of using a smoothed moving average is that it provides more accurate results than a simple moving average. This is because the smoothed moving average takes more data points into account than a simple moving average, which reduces noise and makes trend lines more solid and reliable.
Another significant advantage of using a smoothed moving average is that it can be used for both short-term and long-term analysis. Simple moving averages are more beneficial for short-term study because they are quicker to calculate; however, they do not provide an accurate picture of long-term trends.
The main disadvantage of using a smoothed moving average over a simple moving average is that it requires more time to calculate because it uses more data points than its counterpart.

He is an expert in financial niche, long-term trading, and weekly technical levels.
The primary field of Igor's research is the application of machine learning in algorithmic trading.
Education: Computer Engineering and Ph.D. in machine learning.
Igor regularly publishes trading-related videos on the Fxigor Youtube channel.
To contact Igor write on:
igor@forex.in.rs
