Understanding Candlesticks in Forex
Every trader needs specific charts and tools to make trading more accessible and to avoid unnecessary human errors. Candlestick charts are charts that are used to read the price action by the traders. Individual candles form these. These charts allow traders to find the exact price opening for a while and when the prices closed. You can also use these charts to see the price lows and highs for some time.
What are Candlesticks?


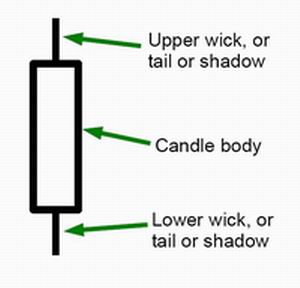
Candlesticks represent a type of price chart that displays the high, low, open, and closing prices of a security for a specific trading period. The Candlesticks Body represents the price range, open-to-close. The Wick or the shadow shows the highs and lows.


How to Read Candlesticks?
To read candlesticks, you need to analyze the Candlesticks Body that represents the price range, open-to-close, and the wick or the shadow shows the highs and lows. On candlesticks, you can see the following information:
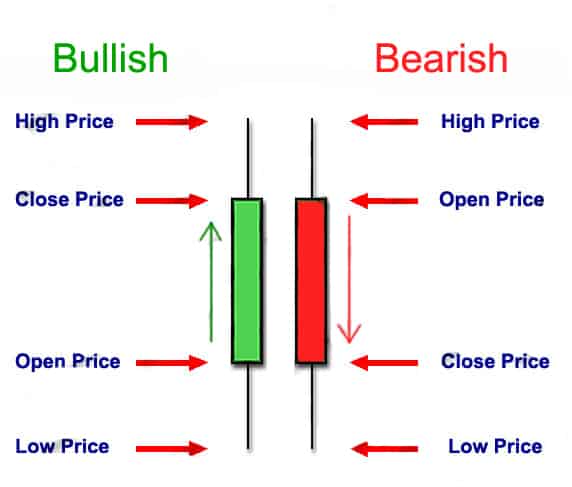

- Open Price
This refers to the first traded price, the opening price, that existed when the candle was forming. You will find the candle turning blue/green if there is an upward trend. You will see a red candle in case of a price decline. Keep in mind that depending on the chart settings, these colors may vary.
- High Price
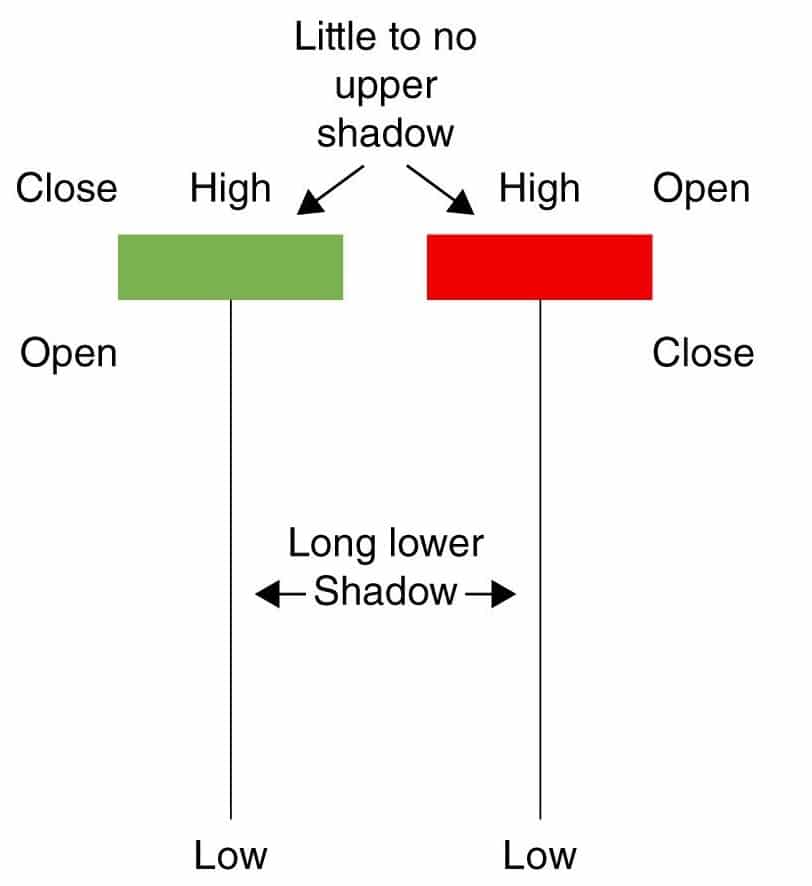
The upper shadow or the wick’s top shows the highest traded price during a particular time. In case a candle does not have an upper wick, it would mean that the highest traded price was either the close price or the open price.
- Low Price
The lower shadow or the wick’s bottom shows the lowest traded price during a particular period. In case a candle does not have a lower wick, it would mean that the highest traded price was either the close price or the open price.
- Close Price
This refers to the last traded price, the opening price, that existed when the candle was forming. The candle will turn red in case the open price is above the close price. On the other hand, it will turn blue/green if the open price is below the close price. Again, colors may vary depending on the chart settings.
- The Wick
Reading candlesticks will only become beneficial if you are well-versed with what a wick is. A wick is also known as the shadow of the candle. Shadows or wicks are used to identify the price extremes for a particular charting period. You can easily distinguish between a candle body and a wick as the wicks are much thinner. A candlestick’s strength becomes apparent at this point. Traders can easily use these wicks to keep an eye out for the market momentum.
- Direction
You can understand the price direction by paying attention to the candlestick color. If the candle’s opening price is below the closing price, you will see a green candle depicting an upward price movement. Similarly, if the candle’s opening price is above the closing price, you will see a red candle representing a downward price movement.
- Range:
The range of the candle refers to the difference between the lowest and the highest prices. You can easily calculate it by subtracting the price at the upper wick’s peak from the price at the lower wick’s bottom.
Reading candles for Forex trading is essential as you can get a lot of viable information. The vital data provided by these charts is price action. Traders can use this to identify upcoming trends and possible reversals. A group of candlesticks, for example, can form patterns occurring across the Forex charts. Based on a few other factors, it could either indicate a continuation of trends or trend reversals. When these candlesticks form individual formations, they could pinpoint possible entry and exit points.
Every candlestick is built differently and shows data related to the period selected by the trader. Therefore, the exact answer to understanding a candlestick chart depends on the preferences of the trader. The daily time frame is one of the most popular time-frames used in Forex trading. You will learn about that day’s price highs and lows and opening and closing prices as well. Understanding candles in Forex varies a lot as various components allow you to forecast different aspects. For example, if a candle closes considerably below its opening point, it may hint towards a further decline in the prices.
How To Interpret Candlestick Chart Patterns
Understanding candlestick charts for beginners can be a little tricky, but you can do it quickly once your basics are right. First, you must pay attention to all the single candle components because charts are formed by individual candles coming together. Every candle has three significant points – wicks, close and open. When looking at the candles, the foremost thing to do is to pay attention to the opening and closing prices depicted by the candles. This will help you identify where an asset price begins and ends for the time-frame you have selected. Keep in mind that every candle stands for a different time frame and subsequent price movement. Therefore, it is essential to look at the bigger picture. When it comes to the daily chart, you will see the close, open, lower, and upper wick of the day.
How To Read Candlestick Patterns
To read candlesticks patterns you need to analyze various forms of two candle formations and multiple candlestick formations and to know which of them hypothetically predict a bullish or bearish trend.
There are different types of candlestick charts, and there are ample ways of reading them. Based on trading strategies and time frames, these are the best ways to read candlestick charts:
1. Single Candle Formation Interpretation
You can learn a lot about the current market sentiments with the help of individual candlesticks. The hanging man, the shooting star, and the hammer are examples of this category that can tell you about the changing momentum and price trends.
Example on hanging man
The hammer candlestick is often used to identify trend reversals. Based on where the prices close and open and the wick’s size compared to the candle body, traders can form their respective strategies.
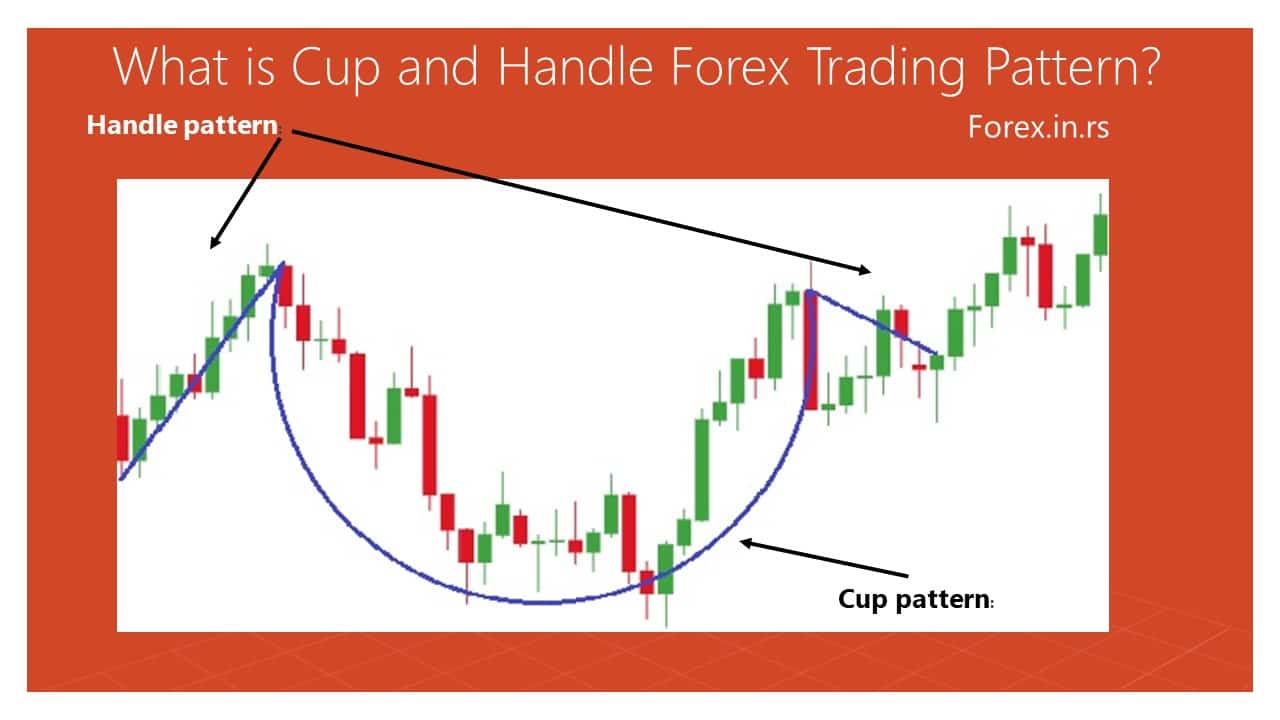
2. Multiple Candles and Price Patterns
Some of the most popular multi candle charts are Cup and handle, triangle patterns, bullish engulfing patterns, etc. You can employ these patterns to figure out the entries and the exits of the market. If you are using multi candle patterns, it is better to deep-dive and understand each pattern’s format.
The bullish engulfing pattern is formed with a combination of blue and red candles. The blue candles engulf the red candles, hence the name. This pattern shows the end of the weakness of the currency pairs. You can use this information to enter a long position once the blue candle has closed. The trader below the bullish pattern will place a stop loss to ensure a tight stop loss in the hammer position. The next step would be to set the take-profit.
Conclusion
Understanding candlesticks and interpreting candlestick graphs may seem daunting to a new trader, but it is an easy task. Once you have read the basics, you can use these charts to up your trading game. These charts can be used in share, stock, and Forex trading. If you are still not confident about them, we suggest that you start with a small investment and with a small time-frame. You can invest more and upgrade your trading strategy once you are comfortable with its various aspects. Candle reading in the share market and any other trading will help you in becoming a better trader.

He is an expert in financial niche, long-term trading, and weekly technical levels.
The primary field of Igor's research is the application of machine learning in algorithmic trading.
Education: Computer Engineering and Ph.D. in machine learning.
Igor regularly publishes trading-related videos on the Fxigor Youtube channel.
To contact Igor write on:
igor@forex.in.rs
Related posts:
- What is Candle Tail?
- Evening Star Forex Pattern
- How to Read Forex Charts?
- Hollow Candle Chart
- Double Doji Candlestick Pattern!
- High Probability Reversal Candlestick Patterns – Case Study
- Morning Star Forex Pattern
- How to Read Forex Bar Charts?
- What is Bullish Reversal?
- Bullish Inverted Hammer Candlestick Pattern
- Doji Candlestick Patterns
- Download Heiken Ashi Smoothed Indicator – What is Heiken Ashi Trading Indicator?
