Typically candlesticks can have various colors in charts. Usually, a bullish candle has green color and bearish red color. Each trading platform has a different way of how presents candlesticks.
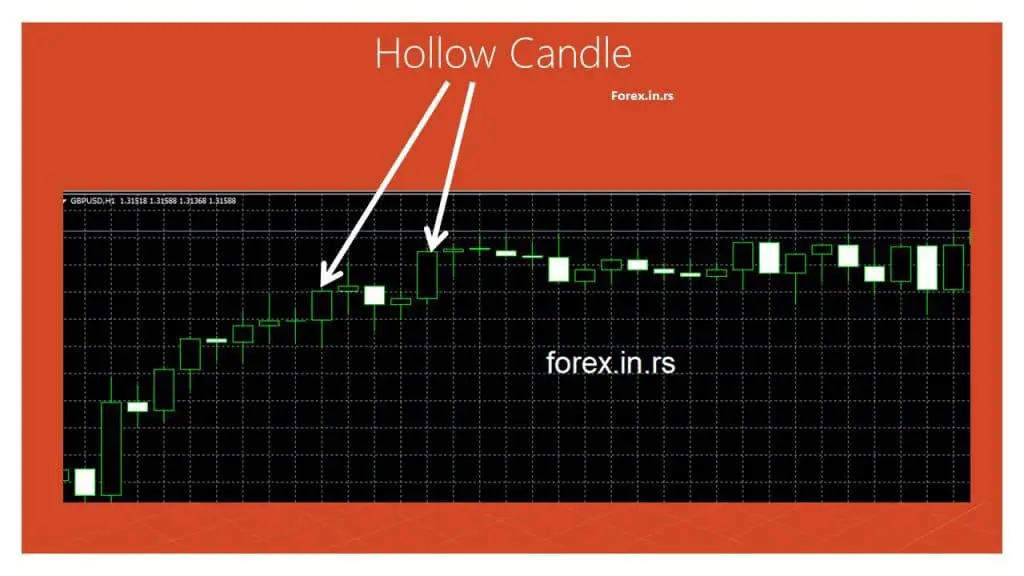
A hollow candle plot on the chart the difference between the close of the current bar and the open price of the current bar and tell traders that security moved higher after it’s open. A candlestick with a hollow body where the close price is above the open price level is called a bullish candlestick.


Metatrader hollow candle chart


Below we can see a video about a hollow candle:
Hollow candle and other trading platforms
In some platforms, this is denoted by choosing the black color for both the down and the up color. In reality, the coloring of candlesticks is far more complicated than what most people realize. Most people do not realize that there is no white candlestick in the candle chart, when the candlestick is hollow, it appears to be white in color.

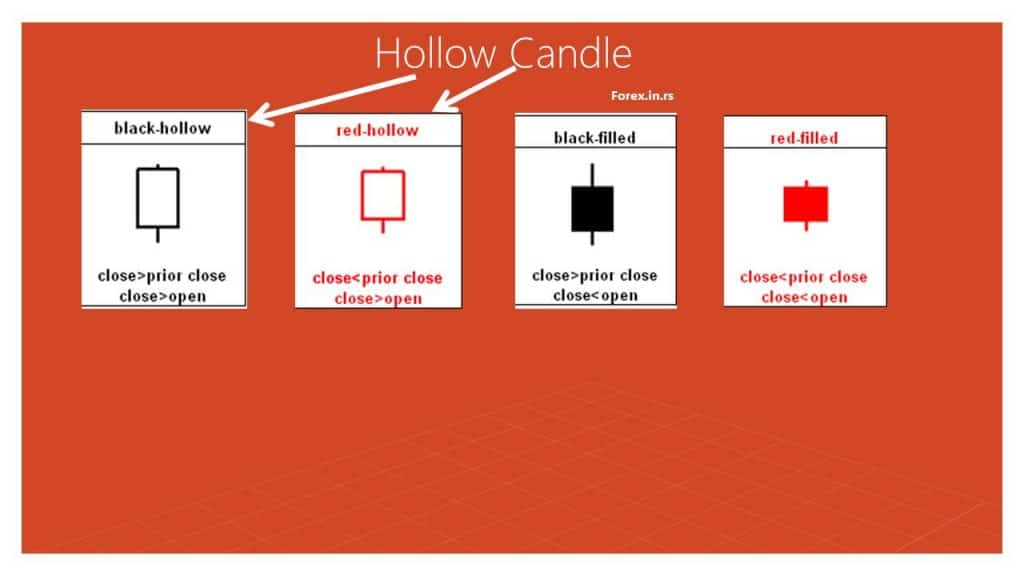
A hollow red candle represents a bullish candle where the prior close was greater than the current close and the current close is above the current open. A hollow black candle represents a bullish candle close is above the prior close and current open.
In sharp charts, the default option is that the candlestick chart is displayed along with volume bars behind the chart. In some cases, the volume is colored and may be visible behind the hollow candle. So if the chart user finds this confusing, there is an option provided for separating the candlestick and other charts. There is an option to separate, in the volume drop-down menu, below the chart.
Yellow candlestick
Traders should be aware that when the market is still open, in the charts which are produced, an additional candlestick is added to the chart on the right-hand side. The candlestick parameters depend on the current quote for intraday trading. Since the parameters for the candle are changing, it is drawn using a yellow background to differentiate it from other candlesticks. This yellow background will be removed when the final prices at the closing of the trading session are recorded. Traders who are using a plan which shows the data in real-time should note that the background used for the candle at the far right, is not yellow, it will be green in color
Red, a black candlestick
Traders should be aware that Sharpchart has rules which define the default colors for the candlesticks in the chart. If the closing value for the previous day was equal to or less than the closing market value for today, the candlestick for today (current day) should be drawn in black color. However, if the closing value for a day earlier, is more than today’s closing value, the candlestick for the current day will be drawn using red color. Traders should be aware that these rules are slightly different when compared to the rules which are used for drawing a candlestick which is hollow or filled. These rules which are clearly specified in the first paragraph of the article, use the relationship between the opening price and the closing price for the same day.
This difference is very subtle. The black candlestick is filled, while the red candlestick is hollow. In the trading charts of some major companies, filled candlesticks which are black in color, are shown at the major peaks in the chart. This is because in some cases, the share prices of the company have opened at values which are significantly higher than the close for the previous day in a term called gapped up. The prices of these shares have declined from the opening, yet the closing is higher than the closing of the previous day. In some cases, a hollow red candle may appear, because they share prices gapped down, rose in value, yet did not rise above the previous day’s closing prices.

He is an expert in financial niche, long-term trading, and weekly technical levels.
The primary field of Igor's research is the application of machine learning in algorithmic trading.
Education: Computer Engineering and Ph.D. in machine learning.
Igor regularly publishes trading-related videos on the Fxigor Youtube channel.
To contact Igor write on:
igor@forex.in.rs
Related posts:
- What is Candle Tail?
- Candlestick Pattern Indicator MT4 Download – Candle Pattern Recognition
- Download Forex Bar Timer Indicator – Candle Time Indicator MT4
- Evening Star Forex Pattern
- How to Read Candlesticks?
- Piercing Pattern Candlestick
- Double Doji Candlestick Pattern!
- Engulfing Trading Strategy – Case Study
- High Probability Reversal Candlestick Patterns – Case Study
- Morning Star Forex Pattern
- Download B-Clock Indicator
- How to Change Candlestick Colors on Desktop MT4 and MT5 Platform?
