Table of Contents
Detecting industry patterns is one of the most relevant strategies that stock analysts must learn. Owing to market uncertainty, though, detecting a trend can be challenging. Traders have produced a variety of strategies to help look beyond short-term price swings. They may use exponential smoothing as a starter. There are a variety of markers, like the Heiken Ashi, intended to do something like this.
What is Heiken Ashi indicator?
Heiken Ashi (translated from Japanese as “average pace of price” or “average bar”) represents a candlestick pattern that visualizes and highlights the trend direction on the chart. The advantage of the Heiken-Ashi charts is a simple trend determination and smooth price activity by calculating average values.


Indicator Heiken Ashi’s most significant benefit is that it helps you to identify patterns more quickly. The preceding article describes the Heiken Ashi indicator for MT4, presenting traders with details as to what it is, how to add Heiken Ashi to MT4, Heiken Ashi candlesticks, how to use Heiken Ashi patterns to detect market movements, valuable Heiken Ashi trading techniques, Heiken Ashi formula, and a lot more!
How to Use Heiken Ashi Indicator?
The Heiken Ashi indicator is used in trading to identify market trends and smooth out price action by averaging each bar’s open, close, high, and low prices. To use it effectively, traders look for a series of Heiken Ashi candles in the same color, indicating a trend, and use changes in candle color as potential signals for trend reversals.
Heiken Ashi, implying average bar, derives from the Japanese word ‘Heikin Ashi.’ It denotes how the Heiken Ashi predictor adjusts values shown on a graph. Let us just briefly recap the fundamentals of Japanese candlestick patterns before glancing at the nuances of the Heiken Ashi stock trading method. Four elements of price data in graphic form reflect a Japanese candlestick pattern, which includes the following.
- High
- Open
- Low
- Close
This is beneficial because it helps you see several pieces of data plotted on your map each time.

The higher wick or shadow of the candle would depict the high one. The bottom wick or shadow defines the bottom. The structure of a candlestick depicts opening and closing. You will see precisely how it operates throughout the MetaTrader 4 Supreme Version chart.
Essentially, if the closure is,
- It reveals a red candle just below the open one.
- It reveals a blue candle when it would be above the open,
Every candle presents data on the relationship between all the closed and the open. In other ways, it indicates when the value completes the time lower or higher than when it ended. A simplistic line of reasoning would be that a loaded candlestick becomes bearish.
The closing is smaller than the opening and shows the market pressure downwards. The very same line of reasoning indicates that an empty candlestick becomes bullish. A close becoming higher than that of the opening shows increasing market pressure.
Using the Heiken Ashi Indicator involves the following steps:
- Understanding the Candles: Heiken Ashi candles differ from standard candles as they consider the previous candle’s data for their calculations. Each candle is computed using the current and previous periods’ open, close, high, and low.
- Identifying Trends:
- Uptrend: A series of Heiken Ashi candles with no lower shadows (or concise ones) typically indicates a strong uptrend.
- Downtrend: Conversely, candles with no upper shadows often signify a strong downtrend.
- Watching for Reversals:
- Look for changes in the color of the candles. A change from red to green might suggest a potential bullish reversal, while shifting from green to red can indicate a bearish reversal.
- Pay attention to the appearance of long shadows, which can signal a potential reversal in the current trend.
- Combining with Other Indicators: For better accuracy, combine Heiken Ashi with other technical analysis tools like moving averages, RSI (Relative Strength Index), or MACD (Moving Average Convergence Divergence).
- Managing Risk: Use stop-loss orders and other risk management techniques to protect against sudden market moves that could contradict the trend indicated by the Heiken Ashi candles.
- Backtesting: Before applying this indicator in live trading, backtest it with historical data to understand how it performs in different market conditions.
Heiken Ashi Candle Calculation
When the market oscillates, there are contrasting bullish and bearish candles in times of volatility. A move makes the pattern impossible to see. That’s where it comes into Heiken Ashi. To address this problem, we can further use candlesticks. Heiken Ashi candlesticks for MT4 appear identical to traditional ones, except with these four market metrics, they utilize average prices instead of just using openings, closes, peaks, and drops.
The Heiken Ashi formula for getting the average prices,
| High | The highest price value from the high, open, or close of the existing time frame |
| Open | (Opening of last bar + closing of the last bar) / 2 |
| Low | The lowest price value from the low, open, or close of the existing time frame |
| Close | (Open + high + low + close) / 4 |
How to Add Heiken Ashi to MT4?
The excellent thing is that using the Heiken Ashi technique with MT4 is simple. Mainly because, as a standard custom predictor, it is accessible. What you should be doing to utilize it would be:
- Choose ‘Insert’ and ‘Indicators’
- Pick ‘Custom.’
- Select Heiken Ashi
Then, you specify the period for what you want, as with every other candlestick graph. The HA values for the day’s high, low, open, and close are established if you want a regular graph. The Heiken Ashi prices for high, low, open, and close within each hour are specified if you want an hourly graph.
Download the Heiken Ashi smoothed indicator.
There are several Heiken Ashi versions. One of the best versions is Heiken Ashi’s smoothed version, presented below:
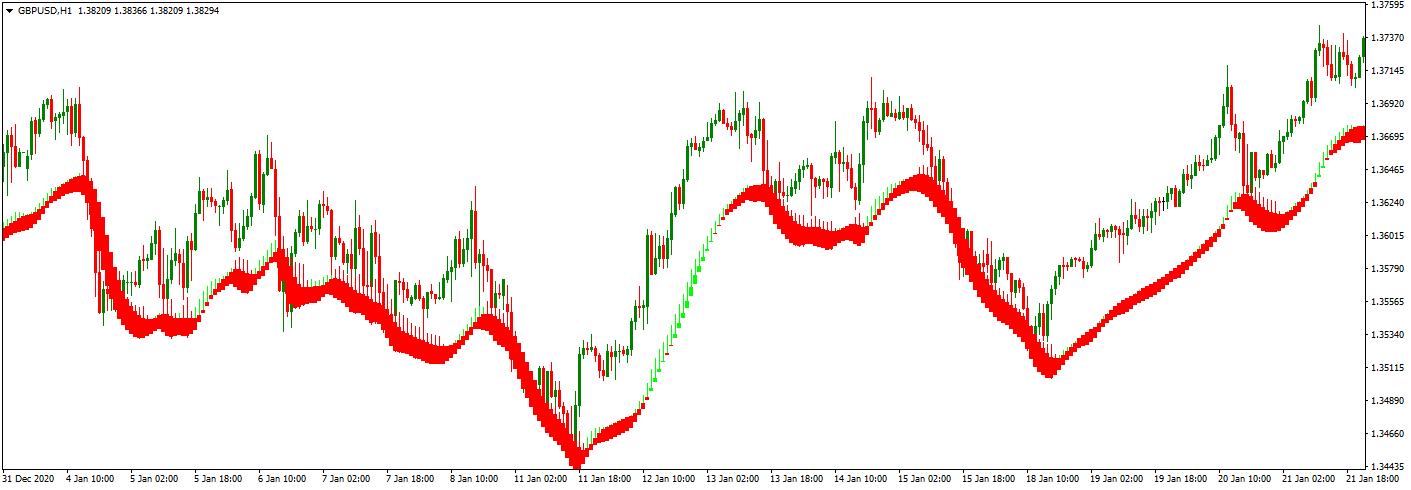
Download the Heiken Ashi smoothed indicator
What are the Default Colors for MT4?
- For bearish candlestick structures and bear candlestick shadows, it is red.
- For bullish candlestick structures and bull candlestick shadows, it is white.
Having a good approach and experimenting with this is the easiest way to feel relaxed using an indication. With a demo brokerage account, anyone can accomplish everything. Remember: Heiken Ashi, through Mt4 Supreme Version, is one of the many full custom available tools.
A Demo Trading Account First
Did you happen to notice that, utilizing real-time market information and analytics from professional trading consultants, it’s better to trade in financial instruments without putting any of your assets at risk? That is correct. Professional investors can evaluate and brilliant their methods without jeopardizing their cash with a demo trading account.
A demo account is an excellent way for a novice trader to get familiar with buying and selling or for experienced traders to start practicing. And whatever intent could be, for modern speculators, a demo account would indeed be a necessary condition.
How Can You Identify Trends Using Heiken Ashi Indicators?
As previously mentioned, Indicator Heiken Ashi aims to make patterns easy to identify. A smoothing method is among the most popular instruments for looking beyond uncertainty. Price levels can turn up or down, and besides, without moving in any specific manner, they might move up and down in even a specific direction when trending. Anyway, such price swings obscure the overall market’s natural character. Averages are also the standards used for constructing Heiken Ashi candlestick patterns.
Averaging tends to mitigate short-term fluctuations in costs. In principle, shouldn’t both candlestick charts help offer a good view of whether you have a bearish or bullish pattern?
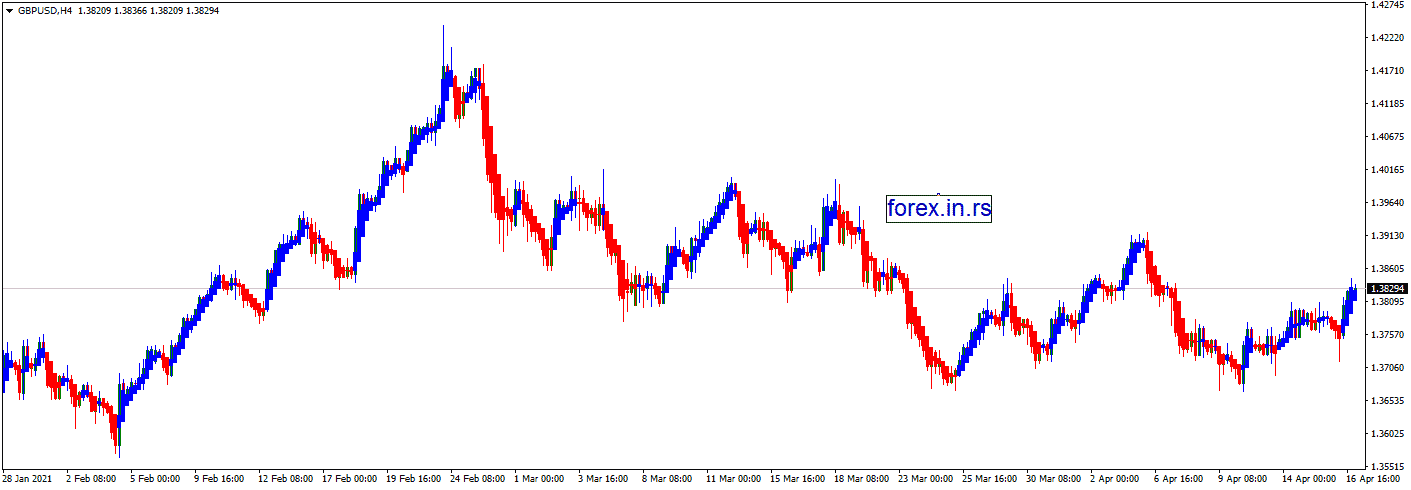
With the HA indicator, note just how clear the signs of bullish and bearish sentiments are. Compared to the Heiken Ashi, the usual candlestick graph reveals more than double the bullish candles.
- A hollow candle (white) without a lower shadow is a bullish sign.
- A filled candle without even an upper shadow is a bearish sign.
Note how the declining cycles commence with candles that have no upper shadow. That will further validate the trend, with several traders utilizing Heiken Ashi and momentum indicators. For instance, an entry signal or a Heiken Ashi moving average strategy could wait for the candles to pass over the 50-period moving average.
If you had been waiting to purchase following an upward reversal and vice versa, you would join when the next supporting candle happens, bullish. Likewise, you might use the Ichimoku Cloud. The Ichimoku Cloud, or the Ichimoku Kinko Hyo, is a trend-following device focused on candlesticks. Initially, it was crafted with traditional candlesticks in view, but now, some merchants prefer Heiken Ashi candles.
The Bottom Line
A Heiken Ashi mixture of Ichimoku will boost the approach and help improve adherence to the theme. But for now, one should not overlook that MT4’s accessibility implies that you can even import other users’ customized indicators. It encourages you to use an extensive range of applications of Heiken Ashi.
You can install the Heiken Ashi oscillator as an instance. The above includes a different graph below your standard one, which indicates if the Heiken Ashi candles show a bullish or bearish sign. Short-term fluctuations less impact the Heiken Ashi graphs as they are focused on average values. Often, traders think that all of this renders the price activity of the marketplace more accessible to distinguish.

He is an expert in financial niche, long-term trading, and weekly technical levels.
The primary field of Igor's research is the application of machine learning in algorithmic trading.
Education: Computer Engineering and Ph.D. in machine learning.
Igor regularly publishes trading-related videos on the Fxigor Youtube channel.
To contact Igor write on:
igor@forex.in.rs
