Most traders are busy and do not have the time to analyze all the statistical data available. They are interested in using graphical charts that represent the data available to help them make trading decisions. The Bar Chart for Day Trading is one of the most popular charts used by day traders. These charts are easy to interpret and read. The bar chart will have an opening foot facing the left, the closing foot on the right side. The bar will have the open, close, high low price for the specified interval, defined by the trader who is using the chart. You can learn more about all chart types in our article How to read forex charts.
What is a forex bar chart?


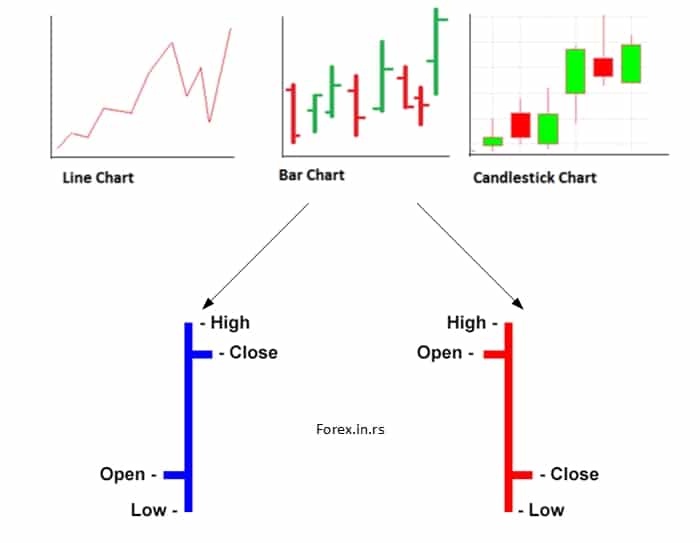
A bar chart is a graphical representation of OHLC (open, high, low, close) price values consisting of an opening foot—facing left—a vertical line, and a closing foot—facing right. Forex bar charts represent vertical bars that show a currency’s trading price level range for the period that traders can analyze, such as a 1-minute bar chart, 5-minute bar chart, 15 minutes bar chart, an hourly bar chart, daily and weekly, etc.


Forex Bar charts:
Day traders often opt for a one-minute bar chart, and a new bar is formed every minute with the prices for each minute. The trader can choose the bar chart’s interval as a specified number of transactions or anything other than time. If the number of transactions is considered instead of time, the chart is called a tick chart. In this chart, a new bar is formed only after a specified number of transactions in the asset are completed. The bar charts are used to detect upward, downward movements and price variation for the bar period. Day traders who assess the price movement using the bar chart and take decisions accordingly are called price-action traders.
Below you can watch the forex bar chart tutorial video:

Reading a bar chart
The bar charts have information on the opening (O), closing (C), high (H), and low (L) prices of the asset during the bar duration and are called OHLC charts. HLC charts are also used, and these have high price, low price, and closing price information
Bar chart Open
The opening price is the price at which the asset is traded during the bar, and the horizontal foot on the bar’s left side indicates the opening price.
Bar chart High
The high for the bar is the highest price at which the asset is traded and is denoted by the bar’s top.
Bar chart Low
The lowest price of the asset during the bar is low and is denoted by the bottom point in the bar
Bar chart Closing
The price at the end of the bar period is close for the asset and is denoted using the horizontal foot towards the right side.
Bar chart Direction
The direction of the asset’s price can be determined by comparing the closing and opening feet in the chart. If the closing foot is higher than the opening foot, the price is moving upward, and if the closing foot is below the opening foot, the asset price has moved downwards. The locations of the bottom, top of the bar chart are used for range calculation. The range of asset price movement is obtained by subtracting the low from the high.
Conclusion
Reading a bar chart requires some practice, significantly if the prices fluctuate very fast. The chart opening is on the left, closing on the right, with the vertical showing the high and low. The bar chart will also include the asset’s transaction volumes, which may be shares, futures contracts, and forex lots. Traders should also consider volumes while making a decision. There are other types of charts like a candlestick, Heiken Ashi, and Renko charts, which traders also use.

He is an expert in financial niche, long-term trading, and weekly technical levels.
The primary field of Igor's research is the application of machine learning in algorithmic trading.
Education: Computer Engineering and Ph.D. in machine learning.
Igor regularly publishes trading-related videos on the Fxigor Youtube channel.
To contact Igor write on:
igor@forex.in.rs
