Candlestick chart patterns developed in Japan and found their way to the Western trading market. These are indicators that are used by traders for technical analysis. Their formation allows traders to keep an eye on the price movement of assets, derivatives, securities, and currencies. These chart patterns include various candles in different colors and shapes. Every candle has two components: a body and one or two wicks. A candle wick is also known as a shadow. It is essential to understand how wicks behave to use this indicator accurately.
What is a Candle Tail?
A candle tail or candle shadow, or candle wick, is an upper or lower line that can be seen protruding from the candle body. It defines the fluctuation period related to the opening and closing prices of an asset. In simple words, these shadows (tail, wick) tell us about the lowest and the highest prices at which trades have been performed for a specific security over a defined period of time.
Candlestick chart patterns are formed with a set of data that includes closing price, opening price, and high-low values. Cumulatively, this data create a candlestick.


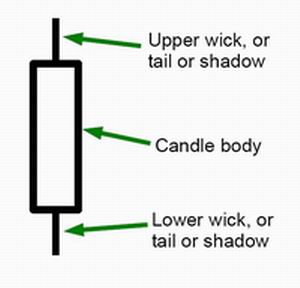
The body of the candlestick can either be a filled or hollowed portion. There are lines on either side of the body that can be called wicks, but it is generally the one on the upper end known as the wick. The one at the bottom is called a candle tail. Whether you call both the lines wick or one tail, both are together known as shadows of the candle.


Learning Candlestick Basics
All the information presented in a candlestick chart is engrained in the body and the shadows. In a data set, the high value is represented by the upper candle tail, and the low value is highlighted by the lower shadow or the candle tail.
You will see a hollow candlestick when the closing price of a security is higher than its opening price. When this happens, the candle tail becomes representative of the security’s opening price, and the candle wick shows the closing price of the same security.
Similarly, you will get filled candles when the sling price is lower than the opening price. The shadows represent the opposite information in this case, with the wick showing the opening price while the tail shows the closing price.

More About the Candle Tail
The shadows show the high and the low values for a specific time period, but there is more than you can learn from them.
These shadows tell analysts and traders about a security’s overall performance during a specific period of time. It allows them to formulate better strategies. When there is a short shadow, it shows that the most active time for that particular security was between the closing and the opening prices. If the shadow is longer, you can assume that the security was traded well before the opening and past the closing prices for a period of time.
The two shadows are seldom equal, and it is important to see which one is longer and which one is shorter. When the candlestick wick is longer than the tail, it shows that buyers took strong actions during the trading session. This long wick is created by a weak low and a strong high.
When the tail is longer than the wick, it shows that sellers were in control of the market during a particular trading session and could bring the prices down to their preference before the buyers pushed the prices successfully up. It signifies a strong close of a session.
Whether at the top or the bottom, the formation of one long shadow majorly happens after a trend has ended and before the price action has reversed, making way for a new trend that will move in the opposite direction.
Spinning Tops
Spinning tops are not very common. They occur when the wick and the tail are of the same size. In this pattern, the body is usually small, making the candlestick look like a spinning top. One shadow is longer than the other; we can check who controls the trading session, traders, or buyers. However, when a spinning top occurs, it shows that the market is going through a period of indecisiveness.
A small body shows that the price movement has been slow throughout the session, and the equally long wick and tail show that both bulls and bears were active during a particular time frame. The result for this time period is either standoff or stalemate.
Conclusion
- A candlestick consists of a candle body and two shadows on either side of it. The upper shadow is called the wick, and the lower one is called the tail.
- The wick’s top part shows the highest part, and the tail’s low part shows the lowest value during a trading session.
- Typically, the shadows’ length differs, which can be used to see whether the buyers or the sellers dominate the market.
- When the lengths of both the shadows are the same, it is known as a spinning top.

He is an expert in financial niche, long-term trading, and weekly technical levels.
The primary field of Igor's research is the application of machine learning in algorithmic trading.
Education: Computer Engineering and Ph.D. in machine learning.
Igor regularly publishes trading-related videos on the Fxigor Youtube channel.
To contact Igor write on:
igor@forex.in.rs
Related posts:
- Hollow Candle Chart
- How to Read Candlesticks?
- How to Trade Pinbars? – Price Action strategy!
- Bullish Inverted Hammer Candlestick Pattern
- Candlestick Pattern Indicator MT4 Download – Candle Pattern Recognition
- Doji Candlestick Patterns
- What is Bullish Reversal?
- Candlestick Reversal Patterns List
- Download Forex Bar Timer Indicator – Candle Time Indicator MT4
- High Probability Reversal Candlestick Patterns – Case Study
- How to Read Forex Charts?
- Double Doji Candlestick Pattern!
