Table of Contents
Pinbars, often considered one of the most powerful candlestick patterns, are vital in the trading world for identifying potential market reversals. Characterized by their tiny bodies and lengthy wicks, they firmly reject prices, indicating that a shift in market sentiment may be imminent. Traders particularly value pinbars because they can provide early warnings of a possible change in price direction, whether in bullish or bearish markets. When a pin bar appears at known support or resistance areas, its significance is heightened, offering traders strategic entry or exit points. Thus, incorporating pinballs into a trading strategy can enhance decision-making by highlighting moments when the market’s momentum may be about to change course.
What is Pin Bar in Forex Trading?
Pin Bar or Pinocchio Bar represents a single candlestick with a long wick that indicates a sharp future reversal or price rejection. The pin bar can be bullish or bearish.


What is a bullish pin bar?
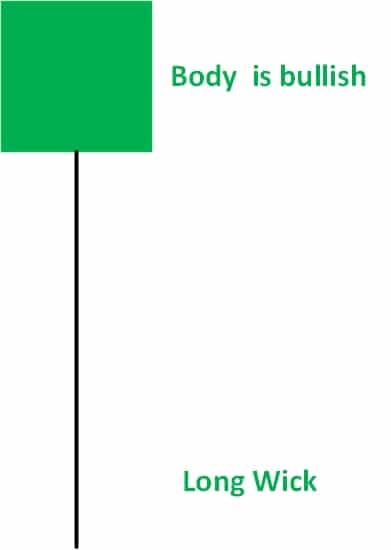
A bullish pin bar is a one-candle pattern with a longer down the wick, represents a sharp reversal or rejection of price, and usually indicates a future rising trend. The image below is an example of a bullish pin bar reversal candlestick:


What is a bearish pin bar?
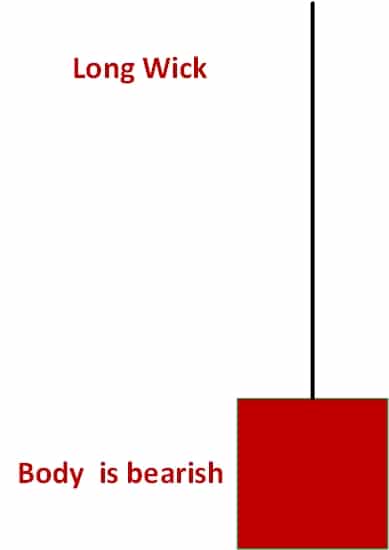
A bearish pin bar is one candle pattern with a long upper wick representing a sharp reversal or rejection of price and usually indicates a future downtrend. The image below is an example of a bearish pin bar reversal candlestick:
One of the many strategies a trader can use to understand the market’s price action is the Pin Bar Pattern. This candlestick pattern derived its name from the expression “Pinocchio Bar” because of its similar shape and relevance to Pinocchio’s nose.

A Pin Car represents an upcoming rejection or reversal in the ongoing price trend. According to Martin Pring, the creator of the Pin Bar pattern, it causes a break in the price movement and brings it back to the price level of the last candle. Therefore, it is advisable to be aware of such breaks in the price, identify such patterns, and avoid getting trapped in short-term trades.
How do you identify the Pin Bar on the chart?
A Pin Bar usually looks like a wick or a wand with a long tail and a shorter body. Because of its shape, it is also known as a ‘wick’ or a ‘shadow.’
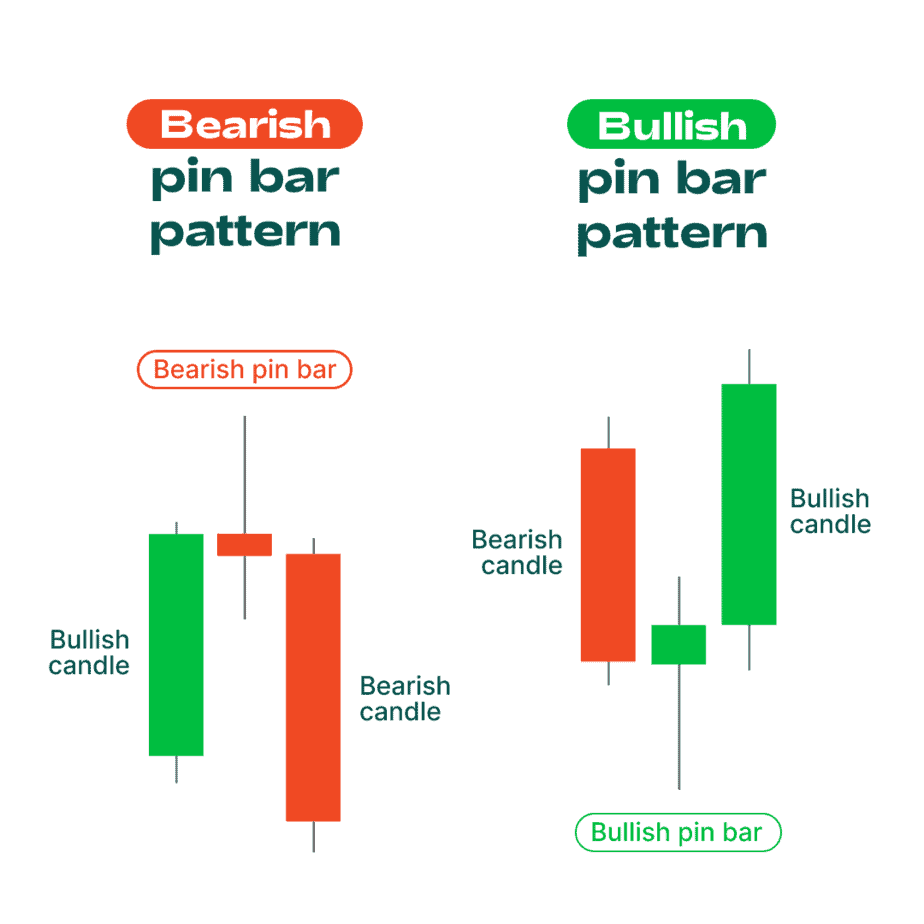
The tail in the Pin Bar pattern is of absolute importance. They are the fundamental indicators of price action. The reliability of the price movement directly depends on the length of the tail. The direction where the tail points are also critical, along with its size. The tail length represents the rejected prices, and the reversal is expected to be the opposite where the tail points. For example, if a Pin Bar pattern has its tail pointing upwards, the Pin Bar rejects the higher prices, and now a bearish or downward trend will approach. Likewise, a downward pointing Pin Bar tail represents the rejection of the lower prices and an approaching upward or bullish trend.
Pin Bar Support and Resistance Strategy
Key chart levels of resistance and support are beneficial to counter-trend or, in simple words, go against the ongoing trend or what the Pin Bar suggests. Resistance and support levels represent strong selling and buying opportunities, respectively. Therefore, if you see that the upper point of the wick in the bearish Pin Bar, appearing in the bullish trend, moves above the critical resistance level, then the issue at the top of the wick is a new sell signal. Also, these resistance and support levels can confirm their signs of a possible reversal.
The best strategy is to trade pinbars in resistance and support zones. In that case, traders can achieve a larger risk-reward ratio.
Pin Bars can also be authenticated when other indicators or patterns support them. For example, this junction of many patterns in a price chart gives stronger signals of the price movement than a single Pin Bar that can merely pause.
Other possible areas of confluence are support and resistance. This holds if two or more technical indicators point towards a possible reversal. It is tough to break these confluence areas. In addition, a higher time frame leads to more substantial areas. You can confirm these confluence zones with the help of various indicators. For example, if an area previously a support level is not showing a double-bottom pattern, this could indicate a possible price confluence area.
It concludes that, as opposed to a single Pin Bar, strong reversal signals are expected when Pin Bars are part of other patterns.
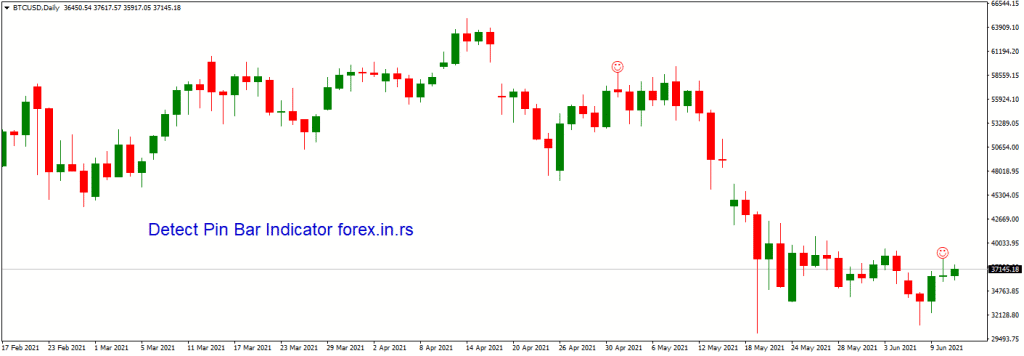
Download the free Pin Bar Detector Indicator.
Below, you can download the pin bar detector indicator. This indicator will mark bullish and bearish pin bar candlesticks, but you have in input ability to set which kind of pin bars to select:
Trading with the Pin Bars
While trading with Pin Bars, traders should remember some important notes to get a better result. First, one must not just look at a pattern with a wick and call it a Pin Bar. It has characteristics that can ensure a strong reversal in the price trend. Otherwise, traders can misjudge such patterns.
Following are some points that a trader should keep in mind while trading with the help of a Pin Bar:
- The length of the whole Pin Bar should be visibly more than that of the previous day’s Pin Bars.
- If it is a bearish Pin Bar, i.e., its wick is pointing upward, then it must appear in-between a bullish trend; only then will it confirm the reversal of the bullish trend. Likewise, the bullish Pin Bar with its wick pointing downward should appear between a bearish trend to confirm the price reversal.
- If the price falls beneath the lower point, one must consider going short in the case of a bullish Pin Bar.
- A trader can also consider putting a stop-entry just above the highest point in the bullish Pin Bar and below the lowest point in the bearish Pin Bar.
- It is advisable to be cautious while stopping loss, as beginners can easily misjudge the pattern, and sometimes, the market may move quicker than expected.
Trading Pin Bars chart pattern and the Fibonacci Levels
- Compute the length of the Pin Bar. Calculate it from the lowest point to the highest.
- The next step is to Bar’s find the 50% and 61st Pin Bar. For this, Fibonacci retracement tools can be used.
- At the 50% level, the entry limit should be placed.
- As mentioned, placing a stop order below the lowest Pin Bar point is advisable.
- Buying at market price is advisable soon after the close of the Pin Bar pattern.
- The level of take-profit can be twice the distance of the entry point.
The visible battle between the bulls and the bears in the Pin Bar pattern to dominate each other and gain their place in the price chart can cause conflicts between the actual price reversal opportunities. It is not always confirmed to see a price reversal right after seeing a Pin Bar; there can be pullbacks. That is where the stop loss helps the traders.
Use the Fibonacci ratio to achieve a healthier risk-reward ratio in case of such pullbacks.
Points to Remember About the Pin Bars
Some more points can help the trader to understand the Pin Bar pattern more clearly.
- It is advisable to consider the price movement near or before the pattern in the price chart. This is because not all the patterns can confirm the reversal of price. For example, if the Pin Bar, bullish or bearish, is not strong enough or its length is smaller than it should be, it is not a price reversal signal but only a pause in the trend.
- The Pin Bande are significant price char are significant. Some may also state that the ideal size of the whole body of this bar body should be between 20% and 30 lengths of the pattern for a trader to consider it as an entry or t point. The cause of the similarities is that pin bars confuse the traders with other patterns like the ‘Doji candlestick’ and the ‘identifying pin based on the help of their position and traders to differentiate between these similar patterns.
- Timeframe charts are also essential to consider while trading with Pin Bars. Ideally, 4-hour timeframes are much better than 5-minute timeframes. Daily timeframes can also be regarded as suitable.
- The tip of the bar points in the ointing direction opposite to the trend, which is the expected direction. Thus, a bearish pin bar has its tail pointing upwards, while a bullish pin bar has its tail pointing downwards.
- Always compare the length of the Pin Bar wick with the previous price trends. It may be a fake Pin Bar if it does not exceed it.

He is an expert in financial niche, long-term trading, and weekly technical levels.
The primary field of Igor's research is the application of machine learning in algorithmic trading.
Education: Computer Engineering and Ph.D. in machine learning.
Igor regularly publishes trading-related videos on the Fxigor Youtube channel.
To contact Igor write on:
igor@forex.in.rs
