Table of Contents
In the dynamic world of forex trading, traders constantly seek reliable indicators to gain insights into market trends and make informed trading decisions. One such indicator that has gained popularity among technical analysts is the Relative Momentum Index (RMI). The RMI is a versatile tool that combines elements of both momentum and relative strength indicators to provide a comprehensive view of price movements. This article will delve into the concept, calculation, interpretation, and application of the RMI in forex trading.
Understanding the Relative Momentum Index (RMI): The Relative Momentum Index (RMI) is a


What is RMI Indicator?
RMI indicator or Relative Momentum Index represents a technical indicator that measures the strength and velocity of price movements. Developed by Roger Altman, the RMI addresses some limitations of other popular indicators, such as the Relative Strength Index (RSI) and the Stochastic Oscillator.


Download the Relative Momentum Index RMI indicator
Download the Relative Momentum Index RMI indicator
The Relative Momentum Index formula
Calculation of the RMI: The RMI is calculated using a two-step process. First, the Relative Strength (RS) is calculated by dividing the average of the upward price changes over a specified period by the average of the downward price changes over the same period. Next, the Relative Momentum (RM) is derived by smoothing the RS values using exponential moving averages (EMA). Finally, the RMI is calculated by applying another EMA to the RM values.
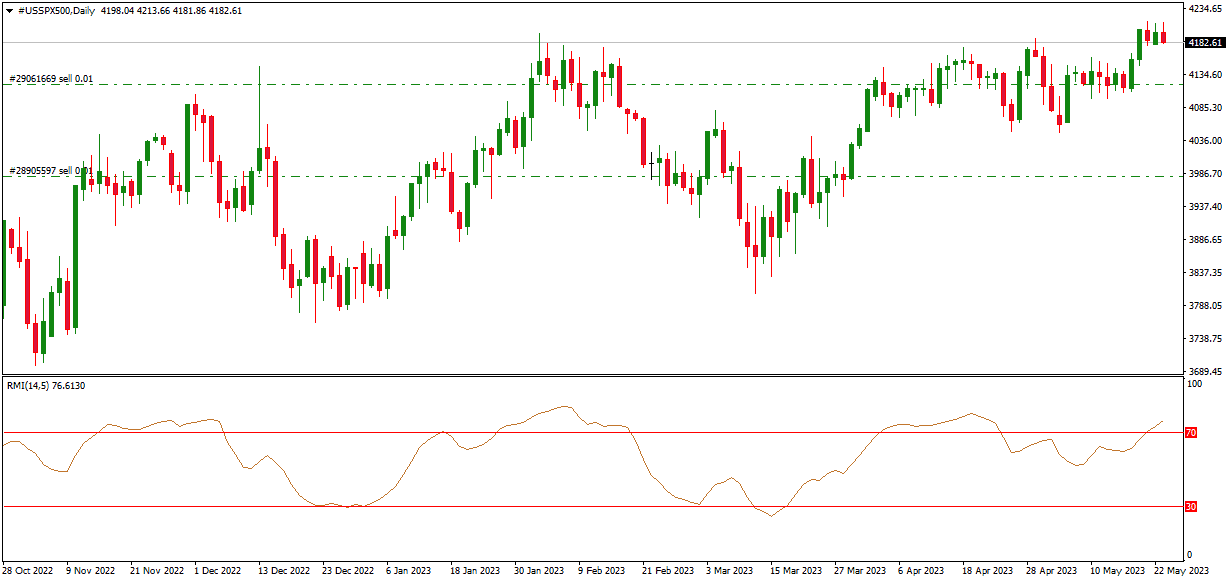
Interpreting the RMI: The RMI oscillates between 0 and 100, similar to the RSI. However, unlike the RSI, the RMI utilizes a centered oscillator approach, providing a more balanced perspective. The RMI values above 70 indicate overbought conditions, suggesting a potential reversal or correction. Conversely, RMI values below 30 indicate oversold conditions, signaling a possible upward price movement.

The RMI’s overbought and oversold levels are typically set at 70 and 30, respectively. The RMI can remain at these extreme levels during strongly trending markets for extended periods. Conversely, in non-trending markets, it oscillates more predictably between the upper range of 70 to 90 and the lower range of 10 to 30.
You can read our article to learn about the best momentum indicator.
How to use RMI in trading?
- Overbought and Oversold Levels: Traders often use RMI levels of 70 and 30 to identify potential reversal points. When the RMI crosses above 70, it suggests a potential sell signal, while a crossover below 30 indicates a possible buy signal.
- Bullish and Bearish Divergence: Divergence occurs when the price and RMI trends move in opposite directions. A bullish divergence occurs when the price makes lower lows, but the RMI makes higher lows, indicating a possible trend reversal. Bearish divergence, on the other hand, occurs when the price makes higher highs, but the RMI makes lower highs, suggesting a potential downward reversal.
- RMI Trendline Breaks: Traders often draw trendlines on the RMI to identify breakouts. A break above a downward trendline can indicate a potential bullish move, while a break below an upward trendline can suggest a bearish move.
Developed by Roger Altman and introduced in the February 1993 issue of Technical Analysis of Stocks & Commodities magazine, the Relative Momentum Index (RMI) has become a popular indicator among forex traders. A variation of the Relative Strength Index (RSI), the RMI offers unique features that make it a valuable tool in technical analysis. In this article, we will delve into the workings of the RMI, its similarities and differences compared to the RSI, and its application in forex trading.
RMI formula and calculation
The Relative Momentum Index (RMI) formula combines elements of momentum and relative strength indicators. The RMI is calculated in several steps:
- Step 1: Calculate the Price Change (PC) for each period: PC = Close – Close[x], where x represents the number of periods ago (e.g., 1 for the previous period).
- Step 2: Calculate the Upward Momentum (UM) and Downward Momentum (DM): UM = Sum of positive PC values over a specified period (e.g., 14 periods), DM = Sum of negative PC values over the same specified period
- Step 3: Calculate the Relative Strength (RS): RS = UM / DM
- Step 4: Calculate the Relative Momentum (RM): RM = 100 – (100 / (1 + RS))
The resulting RM values oscillate between 0 and 100, similar to the RSI (Relative Strength Index). Higher RM values indicate stronger upward momentum, while lower values indicate stronger downward momentum.
The RMI is an oscillator that measures the strength and velocity of price movements. Unlike the RSI, which counts up and down days from close to close, the RMI counts up and down days from the close relative to the close x-days ago, where x can be any desired period. This flexibility allows for a more versatile analysis of price changes.
The RMI calculation involves two key components: the momentum parameter and the smoothing period. The momentum parameter calculates the price change over a specific period, often set as 1-day by default. The smoothing period uses exponential moving averages (EMA) to smooth the momentum values. The resulting RMI oscillates between 0 and 100, similar to the RSI, providing overbought and oversold signals.
Let’s consider a practical example to understand the RMI formula and calculation:
Suppose we have the following daily closing prices for a currency pair over seven days: Day 1: $1.2000. Day 2: $1.2100. Day 3: $1.2200. Day 4: $1.2300 Day 5: $1.2250 Day 6: $1.2150 Day 7: $1.2050
To calculate the RMI, we follow these steps:
Step 1: Calculate each day’s price change (upward and downward). Day 1: Upward change = 0 (no previous day) Day 2: Upward change = $1.2100 – $1.2000 = $0.0100 Day 3: Upward change = $1.2200 – $1.2100 = $0.0100 Day 4: Upward change = $1.2300 – $1.2200 = $0.0100 Day 5: Downward change = $1.2250 – $1.2300 = -$0.0050 Day 6: Downward change = $1.2150 – $1.2250 = -$0.0100 Day 7: Downward change = $1.2050 – $1.2150 = -$0.0100
Step 2: Calculate the Relative Strength (RS) for each day. RS = Average of upward changes / Average of downward changes
In our example: Average of upward changes = ($0.0100 + $0.0100 + $0.0100) / 3 = $0.0100 Average of downward changes = (-$0.0050 – $0.0100 – $0.0100) / 3 = -$0.0083
RS = $0.0100 / -$0.0083? -1.2048 (Note: RS can be downbeat)
Step 3: Calculate the Relative Momentum (RM) using exponential moving averages (EMA). RM = EMA(RS, n) Here, n represents the smoothing period, typically set as a parameter.
For example, if we use n = 3: RM = EMA(RS, 3) = (RS * (2 / (n + 1))) + (previous RM * (1 – (2 / (n + 1))))
Using the first day’s RS as the initial RM: RM1 = RS1 = -1.2048
For the subsequent days, we calculate the RM using the formula: RM2 = (-1.2048 * (2 / (3 + 1))) + (RM1 * (1 – (2 / (3 + 1)))) RM3 = (-1.2048 * (2 / (3 + 1))) + (RM2 * (1 – (2 / (3 + 1)))) and so on…
Step 4: Calculate the RMI using another EMA. RMI = EMA(RM, m) Here, m represents the smoothing period for the RMI.
For example, if we use m = 3: RMI = EMA(RM, 3) = (RM * (2 / (m + 1))) + (previous RMI * (1 – (2 / (m + 1))))
Using the first day’s RM as the initial RMI: RMI1 = RM1 = -1.2048
For the subsequent days, we calculate the RMI using the formula: RMI2 = (-1.2048 * (2 / (3 + 1))) + (RMI1 * (1 – (2 / (3 + 1)))) RMI3 = (-1.2048 * (2 / (3 + 1))) + (RMI2 * (1 – (2 / (3 + 1)))) and so on…
The resulting RMI values will oscillate between 0 and 100, indicating overbought and oversold levels, with 70 and 30 commonly used as thresholds.
RMI vs. RSI
While the RMI shares similarities with the RSI, such as measuring overbought and oversold conditions, it offers distinct advantages. One significant difference is the ability of the RMI to use different periods for counting up and down days, allowing for more flexibility in analysis. The RMI’s centered oscillator approach also provides a balanced perspective compared to the RSI’s focus on close-to-close price changes.
Similarities:
- The Relative Momentum Index (RMI) and the Relative Strength Index (RSI) are popular technical indicators used to analyze price movements.
- Both oscillate between 0 and 100, indicating overbought and oversold levels.
- They can be used to identify potential trend reversals and divergence signals.
Differences:
- RMI counts up and down days from the close relative to the close x-days ago, while RSI counts up and down days from close to close.
- RMI offers more flexibility in choosing the period for counting up and down days compared to the fixed 1-day period of RSI.
- RMI utilizes exponential moving averages (EMA) to smooth momentum values, while RSI uses simple moving averages (SMA).
- RMI’s centered oscillator approach provides a more balanced perspective than RSI’s focus on close-to-close price changes.
- RMI tends to have smoother fluctuations as the momentum periods increase, while RSI’s fluctuations remain consistent.
RMI Application in Forex Trading
The RMI can be utilized in various ways to enhance forex trading strategies. Here are a few practical applications:
- Identifying Reversal Signals: When the RMI exceeds the overbought level of 70, it may suggest a potential trend reversal and a possible sell signal. Conversely, when it crosses below the oversold level of 30, it may indicate a potential trend reversal and a possible buy signal.
- Divergence Analysis: The RMI can detect divergences between price and momentum similar to the RSI. A bullish divergence occurs when the price forms lower lows while the RMI forms higher lows, potentially signaling a reversal to the upside. A bearish divergence occurs when the price forms higher highs while the RMI forms lower highs, potentially indicating a reversal to the downside.
- Trend Confirmation: By monitoring the RMI during trending markets, traders can assess the strength and sustainability of a trend. Consistently high RMI values during an uptrend indicate robust bullish momentum, while consistently low RMI values during a downtrend suggest solid bearish momentum.
The RMI can be used in various ways to enhance trading strategies and decision-making. Here are a few practical applications:
-
- Confirmation of Price Patterns: The RMI can confirm chart patterns such as head and shoulders, double tops, and triangles. If the RMI shows corresponding overbought or oversold levels, it strengthens the validity of the pattern.
- Filtering Trade Signals: By using the RMI with other indicators or trading systems, traders can filter out false signals and focus on trades that align with the RMI’s overbought or oversold conditions.
- Trend Identification: The RMI can help identify the strength and duration of a trend. A consistently high RMI value suggests a robust and sustained bullish momentum during an uptrend.
Conclusion
The Relative Momentum Index (RMI) is a valuable technical indicator that provides insights into market strength, overbought and oversold conditions, and potential trend reversals. Traders can incorporate the RMI into their forex trading strategies to enhance decision-making and validate signals from other technical analysis tools. As with any indicator, combining the RMI with additional analysis and risk management techniques is essential.
The Relative Momentum Index (RMI) is a valuable tool in a forex trader’s arsenal, providing insights into market strength, potential reversals, and trend identification.

He is an expert in financial niche, long-term trading, and weekly technical levels.
The primary field of Igor's research is the application of machine learning in algorithmic trading.
Education: Computer Engineering and Ph.D. in machine learning.
Igor regularly publishes trading-related videos on the Fxigor Youtube channel.
To contact Igor write on:
igor@forex.in.rs
