In technical analysis, oscillators play an important role. They act as momentum indicators. There is an upper band and a lower band. The oscillators fluctuate between these two bands and let the traders know whether the market is overbought or oversold. One of the most common momentum oscillators used by traders and investors is the Twiggs Momentum Oscillator (TMO). It is a relatively new oscillator that Colin Twiggs developed. It is majorly used for its charting feature.
Twiggs Momentum Oscillator represents a trading indicator that measures price fluctuation. A security trend that values greater than zero indicates an up-trend, and values less than zero indicate a down-trend.
You can read our article to learn about the best momentum indicator.


Download Twiggs Momentum Indicator and Script
The Rate of Change Oscillator, also known as the ROC, can be deemed its predecessor because it is a better version. This oscillator was based on reading the percentage fluctuation around the zero lines. The Twiggs Oscillator is regarded as the advanced version of the ROC as it actively identifies the fast trending stocks. This oscillator uses the stock screener to do its job. Just like the momentum oscillator, it enables traders to identify buy and sell signals.
Twiggs Momentum Oscillator Formula

Twiggs Momentum Oscillator Formula compares the current price with the price “n” periods ago ( shows the difference between the current close and close price divided by closing price).
This oscillator takes after the ROC oscillator that uses the following arithmetic formula:
[(Current Closing Price – Closing Price, n days ago) divided by Closing Price [n days ago]], divided by 100
study(“Twiggs Momentum”)
tperiod=input(title=”Period”,type=integer,defval=50,minval=2)
toverbought=input(title=”Overbought”,type=integer,defval=50,minval=1)
toversold=input(title=”Oversold”,type=integer,defval=-50,minval=-9999)
tlongperiod=2*tperiod
tma=ema(close,tlongperiod)
tmo=100*close/tma[tperiod]-100
h1=hline(toverbought,title=’Overbought’,color=gray,linestyle=dashed)
h2=hline(0,title=’Neutral’)
h3=hline(toversold,title=’Oversold’,color=gray,linestyle=dashed)
fill(h2,h1,color=green)
fill(h2,h3,color=red)
plot(tmo)
We can assume that the Twiggs Momentum Oscillator formula is similar to the ROC formula. The proprietor is yet to release an official statement on this.
Identifying Signals on the Twiggs Oscillator
The Twiggs Oscillator is much faster than some of its contemporary oscillators. It works rapidly and can help you in identifying the following:
1. Identification of Fast Trends
Traders who prefer trend trading will appreciate the Twiggs Oscillator. Trend trading involves trading after analyzing an asset’s momentum and the movement of price movement. It is a quick way of trading. There are two ways of identifying these trends using the Twiggs Oscillator (21-days):
- If the oscillator rises above 20%, there is an uptrend
- If the oscillator goes below 20%, there is a downtrend
If you want to trade for the short-term, you can adjust the indicator period to 5 days. Similarly, you can adjust it to 12 months for long-term trading. You have to keep in mind to adjust the gain or loss percentage to 10% for short-term trend trading and 100% for long-term trend trading. The following examples will clarify this for you.
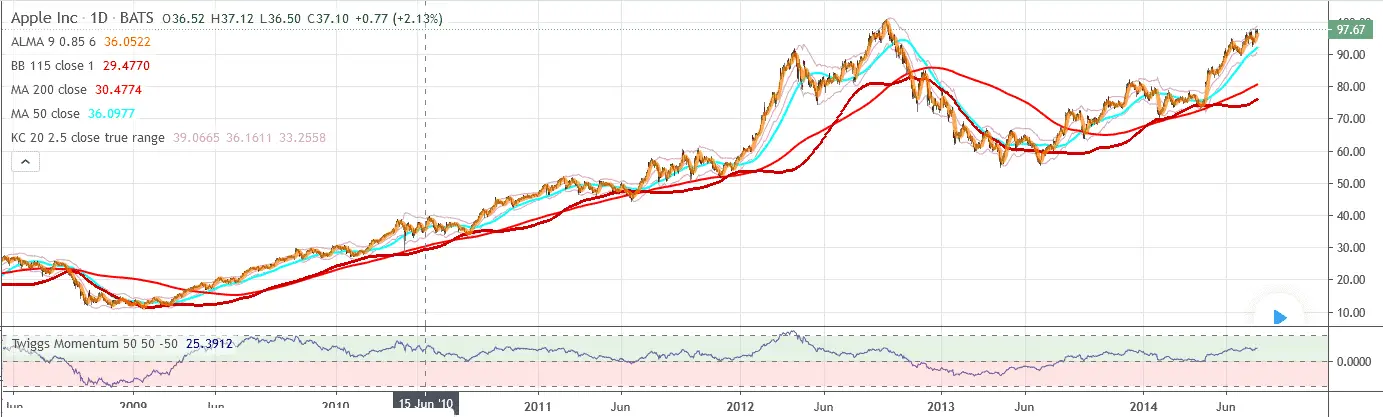
To understand the Twiggs Momentum Oscillator formula, let’s assume that we are trading stocks of Apple Inc. If you look at the AAPL using the 21-day TMO, you will understand everything in a better light. The exponential moving average for 63-days has been used as the trend filter.
In the graph, you will notice:
Suppose you move along the TMO when it rises above 20%, but the price is over the exponential MA. You can increase the long-position when the TMO reverses above 10%. You can also take the signal when the TMO reverses up by 5%.
To understand the long-term trend, let’s consider another example in which we again trade AAPL stocks, but this time, the TMO time period is 12 months.
2. Identifying Buy and Sell Signals
The other important thing that the TMO helps you in identifying are the buy and sell signals. This is more applicable when you are using a short-term oscillator. The first step is to identify the trend which we have already explained in the above point. There is an uptrend when the oscillator is above zero and a downtrend when it is below zero. It would help if you moved along the signals that are in the direction of the trends.
- If there is an uptrend and the TMO is turning upward from below zero, it’s time to go long.
- If there is a downtrend and the TMO is turning downwards from above zero, it’s time to go short.
You can use trailing buy and sell stops to find your perfect entry and exit spot. Use trend line breaks and divergences for take-profit. You can use the trend indicators to find the exit spot.
These trend lines can be easily drawn on the TMO, where the break in the line usually occurs when an identical break is about to occur on the price chart.
Consider the following example for a better understanding:
You can look at the Gold miner Resolute Mining Ltd stock graph to see the movements, also known as RSG, on the TMO (5-days), and the trend filter is chosen as the 63-days exponential MA.
You will notice the following:
- You can see the fast trend when the TWO rises above 10%.
- When the TMO turns up by 5% when it is still below zero and respects the MA price, you can go long.
How to Set-Up the Twiggs Momentum Oscillator
While you can customize the oscillator, its default setting is of 21-days.
You can open the indicator panel and easily customize the oscillator settings as per your needs. You will see several indicators to choose from, along with various charts. There is an option to increase or decrease the number of days. If you are new, we suggest you start with limited indicators for better understanding.

He is an expert in financial niche, long-term trading, and weekly technical levels.
The primary field of Igor's research is the application of machine learning in algorithmic trading.
Education: Computer Engineering and Ph.D. in machine learning.
Igor regularly publishes trading-related videos on the Fxigor Youtube channel.
To contact Igor write on:
igor@forex.in.rs
