Table of Contents
The trading market never operates without the involvement of a certain degree of risk. Prices of securities and instruments move constantly. Some securities are riskier than others as they are more volatile. Volatility defines constant price movement, where the prices can go up and down and come back again. Cryptocurrency is considered one of the most volatile investments. Volatility scares new traders away, but veterans know how to use it for their benefit. With the help of a good volatility indicator, they can strategize more accurately and make a profit. One such indicator is the Choppiness Index.
What is the Choppiness Index?
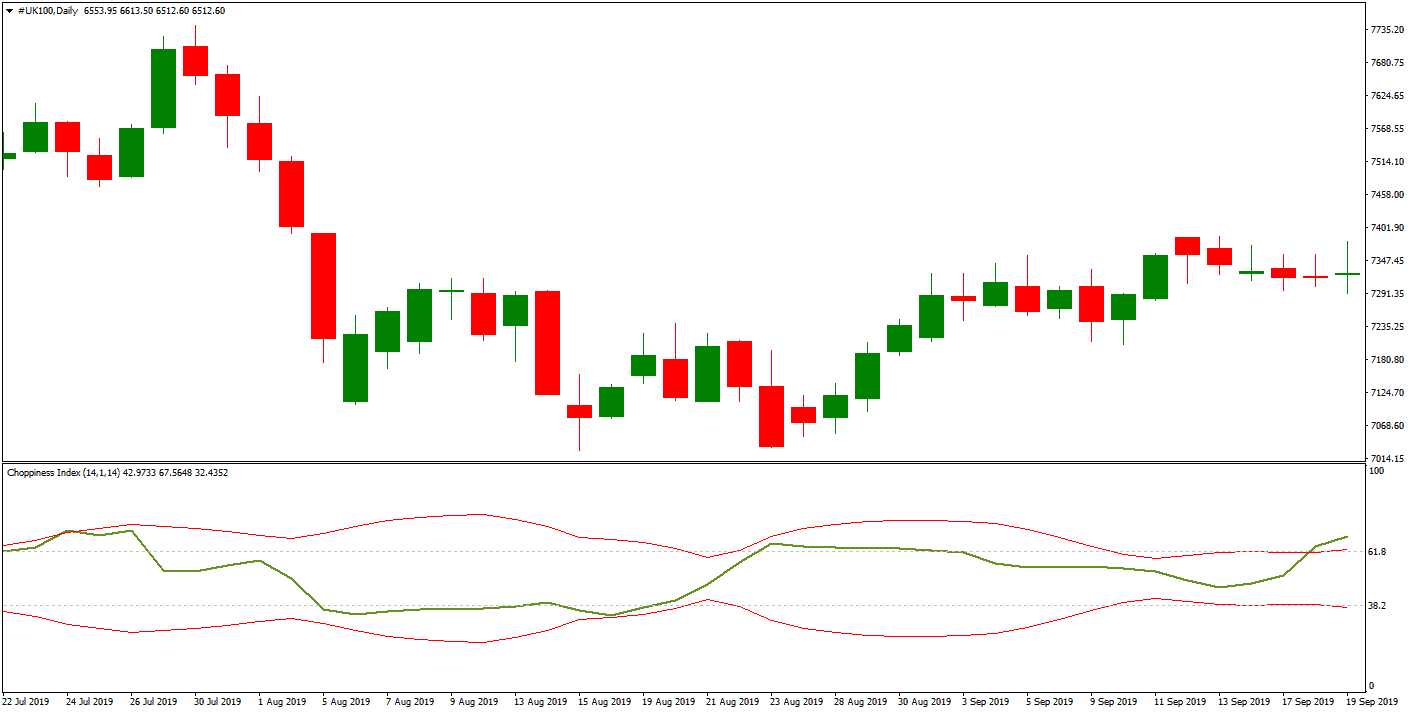
The Choppiness Index represents an indicator developed by an Australian commodity trader, Bill Dreiss, that determines how much the market trades sideways or within a trend. The Choppiness Index uses a scale from 1 – 100 where the choppy market is over 61.80, and the trending market is below 38.20.


Developed by an Australian commodity trader, Bill Dreiss, the Choppiness Index is touted as one of the best volatility indicators. It was designed to highlight the trends of the market solely. It was not to be used to predict any price direction. It was named so because its developer wanted this indicator to determine whether it was choppy (ranging) or not (trending).


Traders can know about the strength of a trend by reading the choppy scale between 0 and 100. The higher values stand for consolidation, while the lower values depict strong trends (directional trending).
Please download the Choppiness Index indicator.

How to use the Choppiness Index in Trading?
To trade using the choppiness index indicator, you must analyze trend strength using higher, lower, and midline thresholds.
Setting the Choppiness Index and using it to find trading signals is effortless. Though its default setting is 14 days, you can easily customize it. For example, Fibonacci values are usually used as extremes when the market is trendy or choppy.
Once you have customized the days, you must look at the scale to identify the signals. These signals will be between zero and a hundred. The scale is divided into three parts:
- The Higher Threshold: If the scale’s value is above 61.8, it is considered the higher threshold. It indicates consolidation in the market.
- The Lower Threshold: If the value on the scale is less than 38.2, it is considered the lower threshold. It shows strong signals. This means that the market has strong trends.
- The Midline: This index is used to measure the current trend status. If the value on the scale is above 50, you can expect trends to remain choppy. On the contrary, if the value is below 50, the market trends tend to persist. This proves the Choppiness Index lags in conveying information about the actual trend.
How to Create Trading Strategies Using the Choppiness Index?
Note that a solitary indicator, tool, or oscillator cannot assist you in creating a solid trading strategy. You have to use every supporting tool in combinations. Here, we use the Choppiness Index with the ADX (Average Directional Index) and the RSI (Relative Strength Index) to generate trading signals. We can expect these three to give us comprehensive buy and sell signals.
Buy signals are generated when the following takes place:
- The Relative Strength Index is more than 60.
- The Choppiness Index closes below 38.2 (lower threshold).
- The Average Directional Index cuts 20 levels from beneath.
You can see all of the above happenings in the graph given below. There is a strong upside rally because the above points co-occur.
Sell signals are generated when the following takes place.
- The Relative Strength Index is more than 40.
- The Choppiness Index closes once more below 38.2 (lower threshold).
- The Average Directional Index against cuts 20 levels from beneath.
RSI causes the only change taking place here. Look at the following graph to see a strong all of the stocks of Religare Enterprises.
The Choppiness Index (CHOP) is a volatility-based indicator to determine the market’s direction. As you mentioned, it was developed by Australian commodity trader Bill Dreiss. It’s a tool that quantifies the degree of market choppiness or the lack of a definable trend.
Components:
- T = True Range for a single period.
- N = Number of periods (usually 14).
- S = Total of True Ranges for N periods.
- A = Average True Range for N periods.
Steps to calculate CHOP:
- True Range (T): This is the greatest of the following:
- Current high minus current low.
- The absolute difference between the current high and the previous close.
- The absolute difference between the current low and the previous close.
- Total True Range (S) over N periods: Add all the T values for N periods.
- Average True Range (A):
- A = S divided by N.
- Choppiness Index:
- CHOP = 100 times the log10 of (S divided by (A times N))
This essential letter representation can help make the formula’s components and structure more straightforward without delving deep into the specifics of each component.
- True Range (T): This is the greater of: a. Current high minus current low. b. The absolute value of the current high minus the previous close. c. The absolute value of the current low minus the previous close.
- The sum of True Range (SUM(T)): You sum up the actual range values over N periods.
- Average True Range (A): Divide the SUM(T) by N.
- Compute the Choppiness Index: Use the formula mentioned above. The logarithm is base 10.
Interpretation remains the same:
- A value near 100 suggests a sideways or choppy market.
- A value near 0 suggests a strong trend.
Interpretation: The Choppiness Index ranges between 0 and 100:
- A value close to 100 indicates a choppy (sideways) market.
- A value close to 0 indicates a trending market.
As you’ve mentioned:
- Choppy Market: A CHOP value greater than 61.8 generally signifies a sideways or non-trending market.
- Trending Market: A CHOP value less than 38.2 typically indicates a strong trend in the market.
Usage: Traders can use the Choppiness Index with other technical indicators. For instance:
- When CHOP indicates a trending market (below 38.2), a trader might look for buy/sell signals from a momentum indicator like the MACD.
- When CHOP indicates a sideways market (above 61.8), a trader might employ range trading strategies or look for breakouts.
Limitations: Like all technical indicators, the Choppiness Index has its limitations:
- It doesn’t provide buy or sell signals on its own nor indicate the direction of a trend.
- There can be instances where the market appears choppy, but it’s actually in the early stages of forming a trend.
- Using the Choppiness Index in isolation can lead to misleading interpretations. It’s often best used in conjunction with other tools and indicators.
Conclusion: The Choppiness Index offers traders a way to quantify market choppiness, helping them adapt their strategies to the prevailing market conditions. Whether trading a trending or sideways market, understanding the nature of the current market can aid in making more informed trading decisions.
Conclusion
While it is great at measuring the current trends, the same cannot be said when it comes to actual trends. The Choppiness Index makes it easier for traders and investors to range and market trends. It is an exciting tool to have on your trading platform.
We will not advise using this or any other tool in isolation. However, when combined with other tools, it helps you identify different types of signals. If you are new to using the Choppiness Index, start with paper or a small investment.

He is an expert in financial niche, long-term trading, and weekly technical levels.
The primary field of Igor's research is the application of machine learning in algorithmic trading.
Education: Computer Engineering and Ph.D. in machine learning.
Igor regularly publishes trading-related videos on the Fxigor Youtube channel.
To contact Igor write on:
igor@forex.in.rs
