Table of Contents
The money Flow Index (MFI) is an oscillator used to measure the strength of money flowing in and out of a security or a market. It is often compared to other oscillators, such as the relative strength index (RSI) and the stochastic oscillator, with each indicator having distinct characteristics and applications. The MFI focuses solely on price and volume, using both to calculate a single value that indicates the buying and selling pressure within a particular security or market.
The Money Flow Index (MFI) is a technical indicator used to measure the strength of money flow in and out of a particular security. It is calculated using volume, price, and positive and negative money flow ratios. The MFI also attempts to gauge whether there is bullish or bearish pressure on the security.


My opinion about MFI interpretation
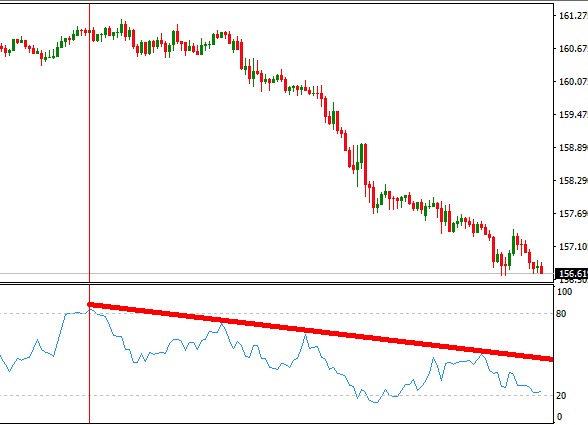
I believe the MFI indicator has fewer missed opportunities (overbought or oversold points to enter into the trade) than the RSI indicator. I like to use this indicator to draw a divergence line or trend line on the MFI indicator histogram.


Now let us see gold chart and all MFI interesting setups:
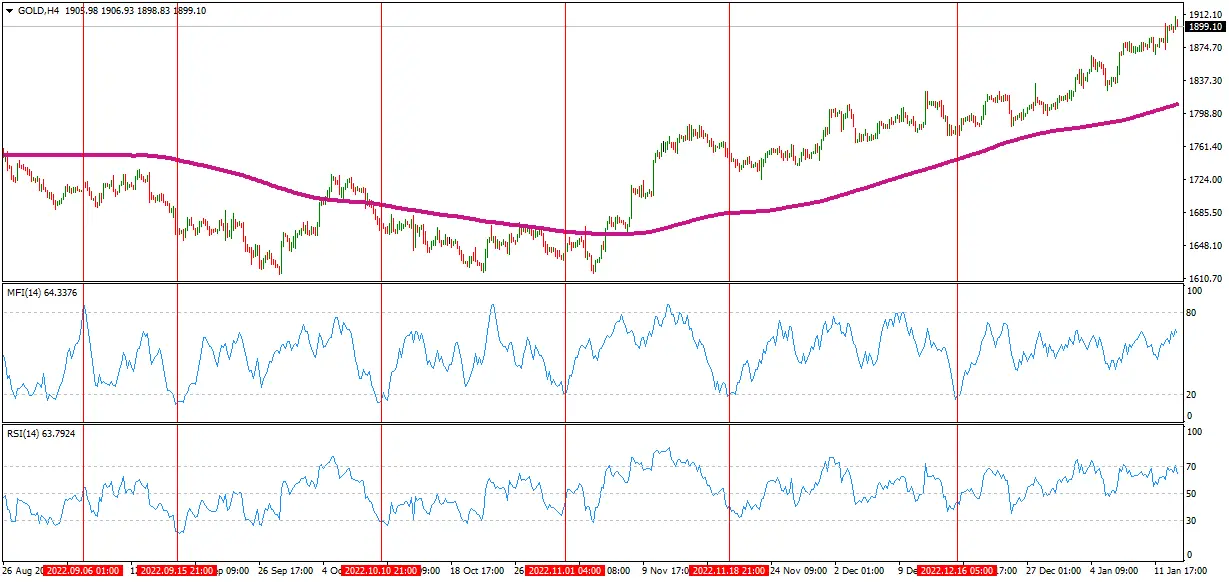
As you can see on my chart above, Gold entry positions for BUY orders are generated by MFI while the RSI indicator does not generate signals for buy orders in several attempts.

See more facts in my video:
The most common way to interpret an MFI reading is through overbought/oversold levels. An MFI reading above 80 indicates that it might be overbought, while a reading below 20 suggests it could be oversold. An increase in positive money flow while rising prices could signal further upside momentum. In contrast, increasing negative money flow while prices fall could signal further downside momentum.
Additionally, divergences between price action and readings on the MFI may signal potential reversals in trends. If a stock advances but its corresponding MFI declines, this could suggest that buying pressure may be waning even if prices remain elevated; conversely, if a stock drops but its corresponding MFI rises, this could mean that selling pressure may begin to decrease even as prices remain depressed; such signals may precede significant trend changes or breakouts from consolidations or trading ranges.
How do you calculate MFI Indicator?
The MFI is calculated using both price and volume data. It considers both the amount of money flowing into security and the amount flowing out of it. This is done by first calculating the “typical price,” which combines the high, low, and close prices for a given period by adding them together and dividing them by three. With this data, two additional calculations can be made. The first calculation considers the positive direction, known as the Money Flow Multiplier (MF). The second calculation assumes the negative approach, known as Money Flow Ratio (MF).
The formula for calculating Money Flow Multiplier (MF):
(Typical Price x Volume)/Previous Period’s Typical Price
The formula for calculating Money Flow Ratio (MFR):
(Positive Money Flow Multiplier/ Negative Money Flow Multiplier) *100
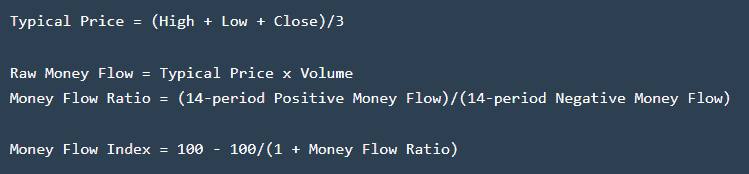
- The MFI uses four components to calculate its value: typical price, raw money flow, money ratio, and the MFI. The first step of calculating the MFI involves finding the regular price for a period.
- This is done by taking the average of the high, low, and close prices during that period. Then you have to compute the raw money flow, which is determined by multiplying the typical price by volume during that period.
- The next step is calculating the money ratio, which is 14-period Positive Money Flow divided by 14-period Negative Money Flow. Finally, you can then compute the Money Flow Index (MFI), which is found by subtracting 100 from [100/(1+Money Ratio)].
Once these calculations have been completed, the resulting values are plotted onto an oscillator graph ranging from 0-100. A reading below 20 indicates oversold conditions, while readings above 80 indicate overbought conditions. In addition to providing information about potential trading opportunities, traders often also utilize MFI readings in tandem with other indicators, such as RSI or stochastic, to confirm signals from either one alone. As with all technical indicators, traders need to remember that no single indicator should be relied upon solely for trading decisions; instead, multiple indicators should be combined to give traders more reliable signals when making decisions about entries or exits from positions.
How to add MFI to the Metatrader platform?
Adding the Money Flow Index (MFI) indicator to a chart in the Metatrader (MT4) platform is a simple process that can be completed within a few steps. The MFI indicator is part of the Volumes section in the MT4 Indicators list and measures both price and volume to identify overbought and oversold conditions in a market.
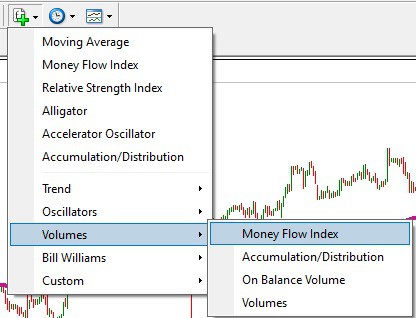
To add the MFI indicator to an MT4 chart, begin by opening up your chart inside the trading platform. If you have not already added indicators to this chart previously, you need to click on “Insert,” located at the top of the screen, and then select “Indicators” from the drop-down menu. This will open up a new window with all available indicators; look for “Volumes” and then select “Money Flow Index” from that submenu. After selecting it, another window will appear asking for parameters; these should be left as default settings unless you want to customize your analysis further.
Once those settings are confirmed and saved, your Money Flow Index (MFI) indicator will be added to your MT4 chart. You can find it in a separate window next to or below your main graph, with its vertical scale of values ranging between 0-100. Overbought conditions occur when prices hit an MFI reading above 80, while oversold signals occur when prices reach an MFI reading below 20.
For traders who’d like more detailed information about their markets, they can opt for customizing their Money Flow Index (MFI) indicator even further by adjusting parameters such as “Timeframe” or “Period.” A longer timeframe allows traders to analyze historical data more extensively, while a shorter period emphasizes short-term movements. Changing any of these parameters will be beneficial if you’re looking for specific levels of detail or to fit your style of trading and analysis better.
The Money Flow Index (MFI) is unique because it can measure both price action and volume together in one single indicator, making it very effective at providing traders with valuable insights into market conditions and potential entry/exit points based on overbought/oversold signals. As long as you follow all steps correctly, adding this technical indicator onto an MT4 chart should be easy enough so that anyone can do it themselves without having any prior experience trading online or using this particular platform specifically.
Conclusion
The money Flow Index (MFI) is a technical indicator used by traders and investors to assess buying and selling pressures within securities or markets based on price movements combined with volume data over specified periods. It plots values between 0-100 on an oscillator graph, with readings below 20 indicating oversold conditions while those above 80 indicate overbought conditions. Traders may combine MFI readings with other indicators, such as RSI or stochastic, to increase their chances for success when trading decisions involving entries or exits from positions.
In conclusion, understanding how to use the Money Flow Index (MFI) can provide traders with valuable insights into market sentiment and possible trend reversals. By combining volume data with price data, traders can gain insight into whether current market movements are backed up by real money flows rather than just speculative noise or false breakouts. While false breakouts frequently occur without any underlying support from buyers and sellers, traders who pay attention to these signals provided by MFIs can help them stay ahead of significant market moves with greater confidence and assurance when managing their portfolios in volatile markets.

He is an expert in financial niche, long-term trading, and weekly technical levels.
The primary field of Igor's research is the application of machine learning in algorithmic trading.
Education: Computer Engineering and Ph.D. in machine learning.
Igor regularly publishes trading-related videos on the Fxigor Youtube channel.
To contact Igor write on:
igor@forex.in.rs
Related posts:
- Download Chaikin Money Flow Indicator for MT4
- What is Commodity Channel Index Indicator?
- Free Download True Strength Index TSI Indicator
- Traders Dynamic Index Indicator – Download TDI Indicator
- Balance of Power Indicator and Strategy – BOP Indicator
- Is RSI Leading or Lagging Indicator? – Everything About Relative Strength Index Indicator
- Download QQE Indicator! How to use QQE Indicator?
- Schaff Trend Cycle Trading System – Cycle Indicator MT4 Download
- Download RMI Indicator – Relative Momentum Index Formula
- How Does the Relative Strength Index work ?
- Average Directional Movement Index Indicator
- What is Trix Indicator? – Download Trix Indicator for MT4
