Table of Contents
The Traders Dynamic Index (TDI) is a versatile indicator that plots market sentiment, trend direction, and market volatility information. This hybrid tool combines elements from the Relative Strength Index (RSI), Moving Averages, and Bollinger Bands to provide traders with a comprehensive market overview.
What is TDI?
Traders Dynamic Index Indicator represents an oscillator indicator combining Relative Strength Index, RSI moving averages, and Bollinger volatility bands. At the same time, the TDI hybrid indicator measures trend direction, market strength, and market volatility.


The TDI is displayed as a bounded oscillator, typically with values ranging from 0 to 100, with a typical mid-point of 50. The TDI consists of different lines that each provide specific insights:
- Green Line (RSI Price Line): This is the RSI of the price line, typically smoothed using a 13-period moving average.
- Red Line (Signal Line): This is the moving average of the Green line, typically smoothed over a 7-period moving average.
- Blue Lines (Volatility Bands): These lines represent the Bollinger Bands and move in response to market volatility.
- Yellow Line (Market Base Line): This is typically a 50-period moving average, serving as a trend direction and strength indicator.
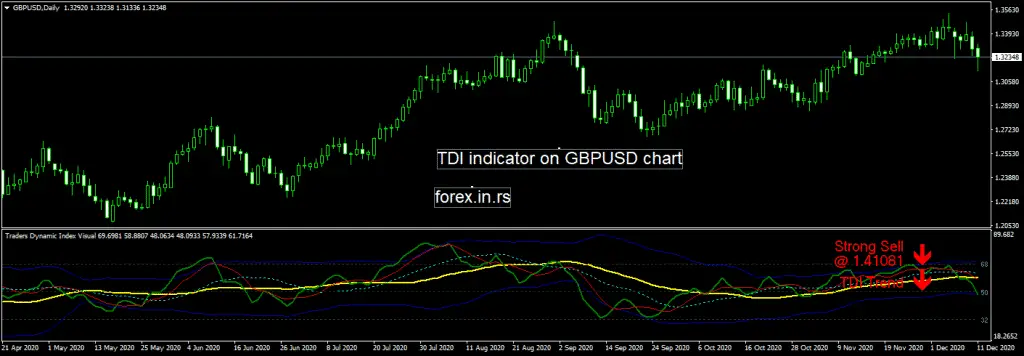
Traders use the TDI to generate various trading signals. For instance, when the Green line crosses above the Red line, it could be considered a bullish signal, and vice versa for a bearish signal. The relationship of these lines with the Blue lines (akin to Bollinger Bands) can provide overbought/oversold conditions.
The TDI Dynamic Index Indicator is a powerful and comprehensive tool that makes trading easier. It uses Relative Strength Index (RSI), Moving Averages (MA), and Bollinger Bands-based volatility. It offers a more condensed manner, allowing Traders to see the complete picture of the Forex market situation. The TDI indicator can use both visual and sound alerts. You can find this indicator on cTrader, MT4, and MT5 platforms.
Download Traders Dynamic Index Indicator
Below you can download the Traders Dynamic Index Indicator in ex4 format. This indicator is created for the MT4 platform.

Download Traders Dynamic Index Indicator
How to use the Traders Dynamic Index Indicator?
TDI lines on the chart are presented as:
- The green line represents the RSI Price line
- The Red-line represents the Trade Signal line
- Blue lines are Volatility Bands
- The yellow line represents Market Base Line
We have a rising trend when the Green-line is over the Red Line. When the Red-line is over the Green Line, we have a downtrend.
We have a market reversal when the price bounces off the Yellow line. Market strength is defined as strong, weak, and moderate. When the Blue lines are incredibly tight in a narrow range, expect an economic announcement or other market conditions to spike the market.
How To Add The TDI Indicator To MT4 & MT5 Mobile App For Android and iOS in 2022?
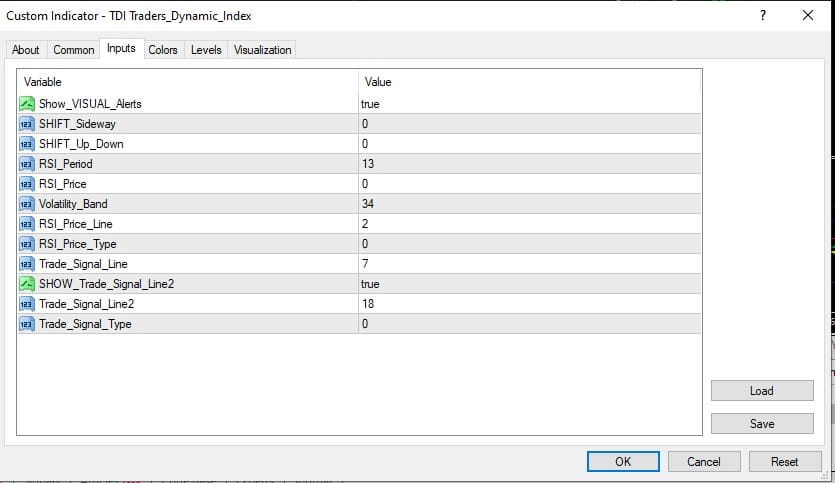
To add a TDI indicator in Mobile App, you need to add MA, RSI, and BB indicators manually:
- Add MovAveragerage where the period is two and set as green color
- Add MovAveragerage where the period is seven and set as red color
- Add MovAveragerage where the period is 34 and set as yellow color
- Add an RSI indicator with period 13 and in the color of your background (for example, black)
- Add BB with periods 34, deviation 1.618, and set as blue color.
TDI Trading Strategy
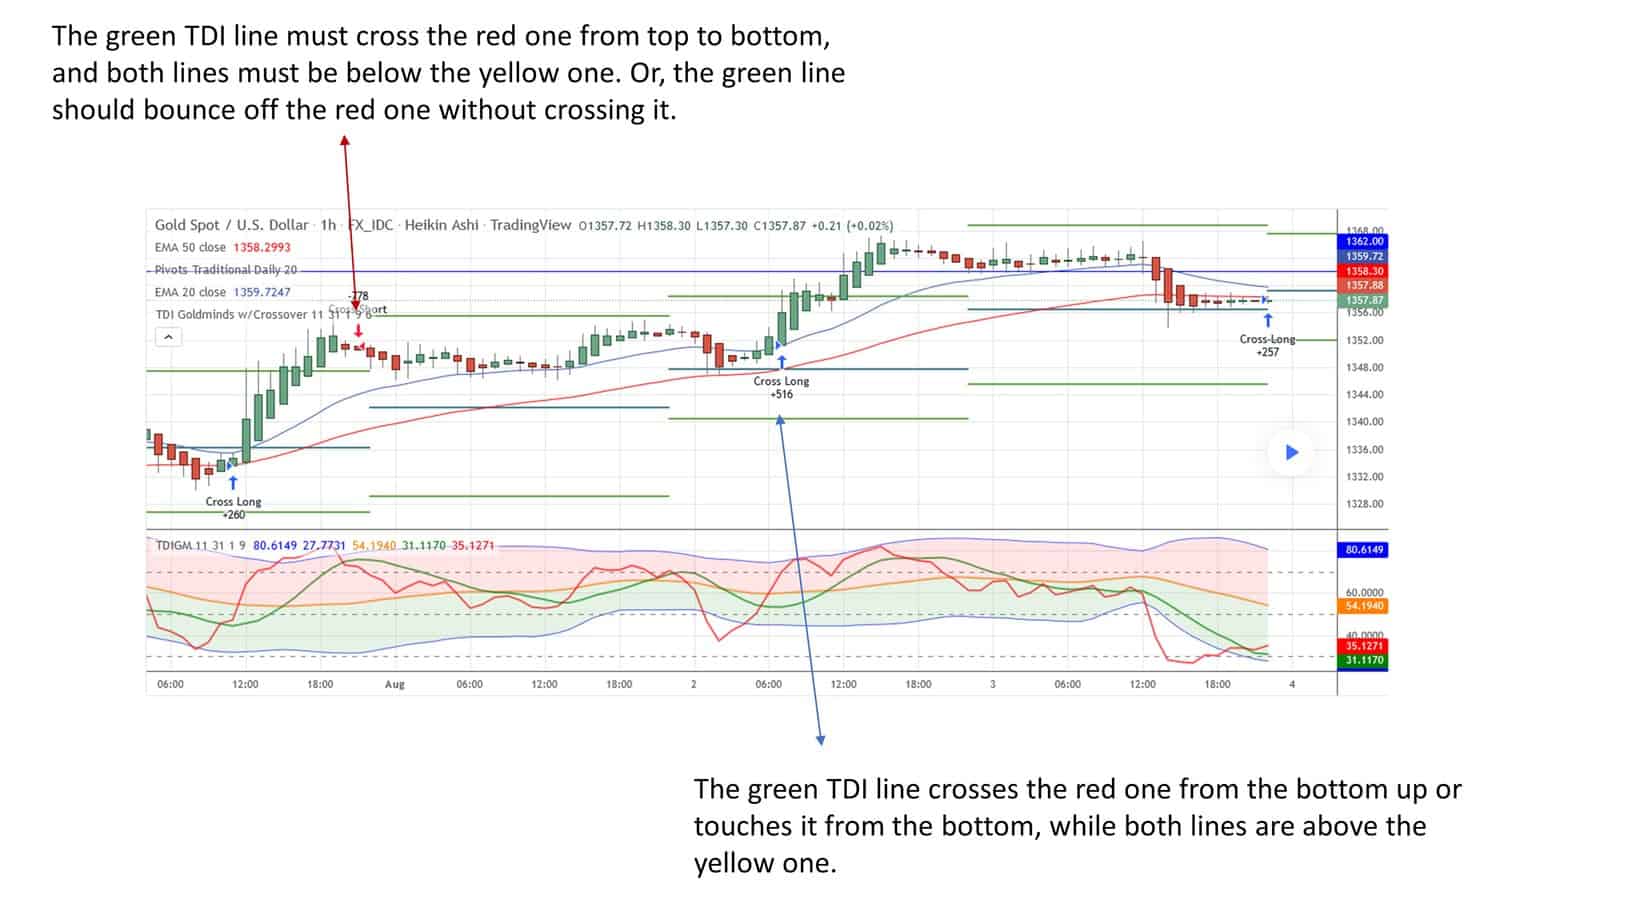
Exit conditions
Long = Green crosses below Red
Short = Green crosses above Red
If Green crosses either Blue line, consider exiting when
when the Greenline crosses back over the Blue line.
RSI Price settings
0 = Close price [DEFAULT]
One = Open price.
Two = High price.
Three = Low price.
4 = Median price, (high+low)/2.
5 = Typical price, (high+low+close)/3.
6 = Weighted close price, (high+low+close+close)/4.
Signal Line Type settings
0 = Simple moving average [DEFAULT]
1 = Exponential moving average
2 = Smoothed moving average
3 = Linear weighted moving average

He is an expert in financial niche, long-term trading, and weekly technical levels.
The primary field of Igor's research is the application of machine learning in algorithmic trading.
Education: Computer Engineering and Ph.D. in machine learning.
Igor regularly publishes trading-related videos on the Fxigor Youtube channel.
To contact Igor write on:
igor@forex.in.rs
Related posts:
- Free Download True Strength Index TSI Indicator
- Choppiness Index Indicator For MT4 Download Free!
- Download RMI Indicator – Relative Momentum Index Formula
- What is Commodity Channel Index Indicator?
- What is Volatility 75 Index? – VIX Volatility 75 Index Indicator Download!
- MBFX Timing Indicator – Free download MT4 Indicator
- Download ADX Histogram Indicator
- Download SSL Channel Indicator For MT4!
- Download QQE Indicator! How to use QQE Indicator?
- Average Directional Movement Index Indicator
- Download Half Trend Indicator MT4
- Download Synthetic VIX Indicator
