Table of Contents
Technical traders need to have an expansive skill set in market patterns, trends, and other actors that dominate the market. This helps make sound trading decisions and bring in profits for the same. While many tools will help you make decisions by presenting various statistics, you need to be aware of the meaning of multiple indicators to reap the substantial benefits from the same. The most prominent technical indicator is the Relative Strength Index or RSI.
What is the Relative Strength Index?
Relative Strength Index or RSI represents a chart indicator that measures price movement speed and change. RSI is an oscillator because its values oscillate between zero and 100. The asset is considered overbought when RSI values are above 70 and oversold when RSI values are below 30.


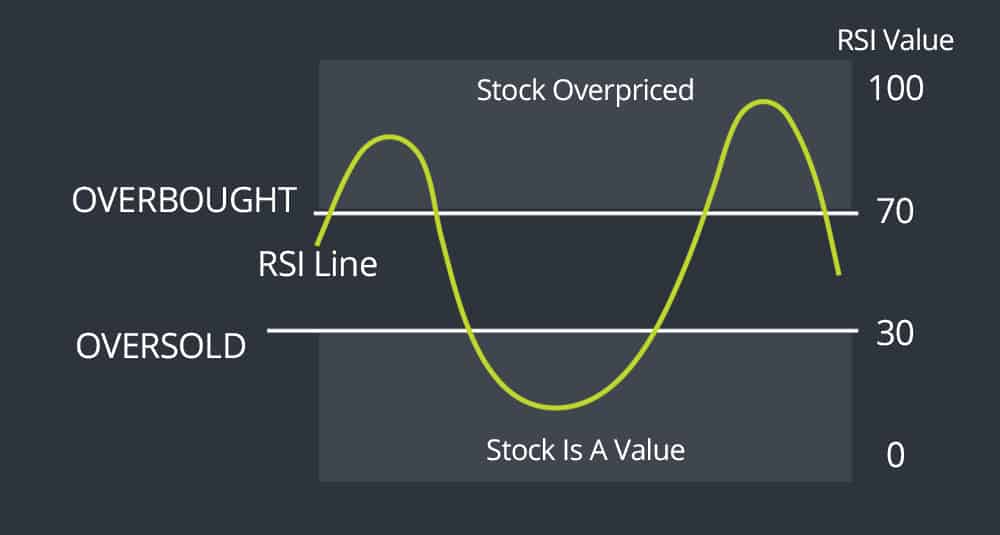


RSI indicator looks like this:
This financial indicator focuses on the speed or momentum of a financial instrument’s price trend to technical traders; it is also called a momentum oscillator. The scale on this indicator goes on from 0 to 200, which indicates if a financial instrument is overbought or oversold. During technical analysis, the traders widely use RSI to monitor the momentum, and it is comparable with indicators like Williams %R or the MACD. However, with the plethora of tools, RSI still gets the preference among the traders because of its simplicity and intuitiveness.
Nevertheless, just like any other financial tool is barred by some drawbacks, RSI on its own has some cons. Hence, the relative strength index should not be used alone but as an integrated part of a mindfully crafted strategy for trading. You should combine the different indicators to determine where your fortunes might shine in the market.
Leading and lagging indicators
In our previous article, we write about leading and lagging indicators in trading.

By definition theory leading indicators point toward possible future events (for example CPI fundamental indicator) while lagging indicators confirm a pattern that is in progress (channel technical indicator ).
Leading indicators in trading show information that in the future can bring bullish or bearish trends while lagging indicators just measure and show unreliable delayed signals.
In technical analysis, Leading Indicators show trade signals on the chart when the trend is about to start and do not change direction based on the current state whereas lagging indicators follow price actions.
Is RSI a Leading or Lagging Indicator?
Relative Strenght Index or RSI is a leading indicator because it shows quantified strength of the trend (from 0 to 100) during the time and does not show delayed signals. However, during a volatile market, RSI can slightly lag before closing the price.
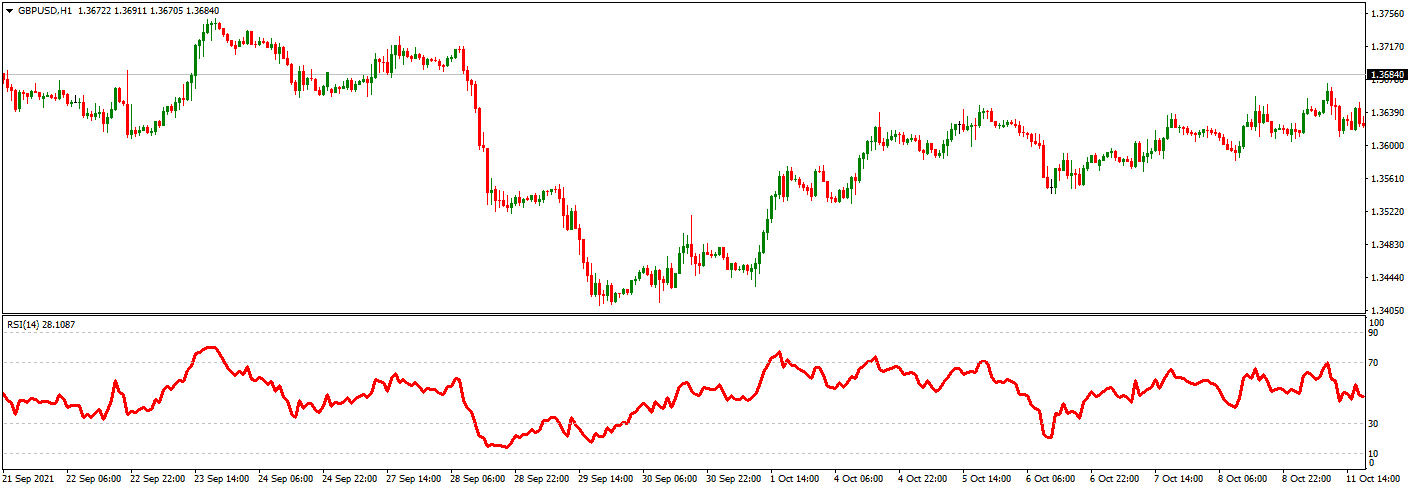
For example, we watch the hourly GBPUSD charts and RSI. The current RSI is 50 at 14:00 on the hourly chart. At 14:20 price can be volatile and can show 53 levels. However, at 15:00 RSI has a value of 51 and it is the only reliable RSI value because RSI close price is only important on the hourly chart.
How to read the Relative strength index RSI?
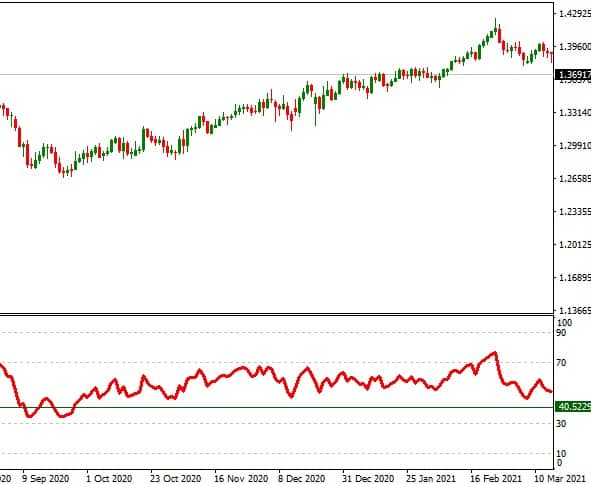
To read the RSI indicator, you need to identify the RSI value on the chart. If the value is below 50, the trend is bearish; above 50 trends is bullish, above 70 overbought and below 30 oversold. However, if the trend is rising and the strong bullish-bearish invalidation level is around 40, while for a strong bearish trend, this invalidation level is 60.
In this image below, we can see that when the trend is vital, RSI is above 50, but sometimes RSI falls below 50 up to 40:
As mentioned, RSI is a momentum tracker or oscillator. This means that there will be two extremes between which the indicator will go to and fro based on the trend of any financial instrument. The two extremes are 0 and 100, respectively. So if your indicator is on 0, it means the financial instrument has been oversold, while 100 represents that the instrument is overbought.
RSI is an excellent tool that helps you find where the trend for a specific stock is going, the condition of the asset’s prices, and the strength in the price trend. The goal behind RSI is to tell traders if the price for their asset is justified or deceiving.
To read RSI with acute precision, you should have a comprehensive idea about the meaning that the values 0 and 100 convey and the process behind their calculations. Hence, you must read this guide on RSI till the end to get profits from your technical analysis.
What are the RSI parameters?
The RSI parameters are the indicator scale from 0 to 100 and the signal line. Usually, if the value is below 50, the trend is bearish; above 50 trends is bullish, above 70 overbought, and below 30 oversold.
RSI is a standard tool that helps traders determine if the asset’s price is running or gaining momentum. That leads the technical traders to discover profitable entry and exit points.
To convey this information, RSI comprises two crucial components in an all-inclusive approach to finding out the best avenues in trade:
- Indicator scale: The RSI has a scale of 0 to 100 to depict certain situations in a trend. This scale has the markings of the numbers on its Y-axis, and hence it’s a crucial part of the scale.
- Signal line: This line keeps wavering across the scale based on the price trends. This runs along the X and Y axis to show that the trend and price significantly affect each other.
How accurate is the Relative strength index?
The relative strength index is not an accurate indicator because it does not predict future prices; it shows current trend strength and price speed and helps traders better spot vital time to enter into trade. So, RSI is not a prediction tool to have accuracy.
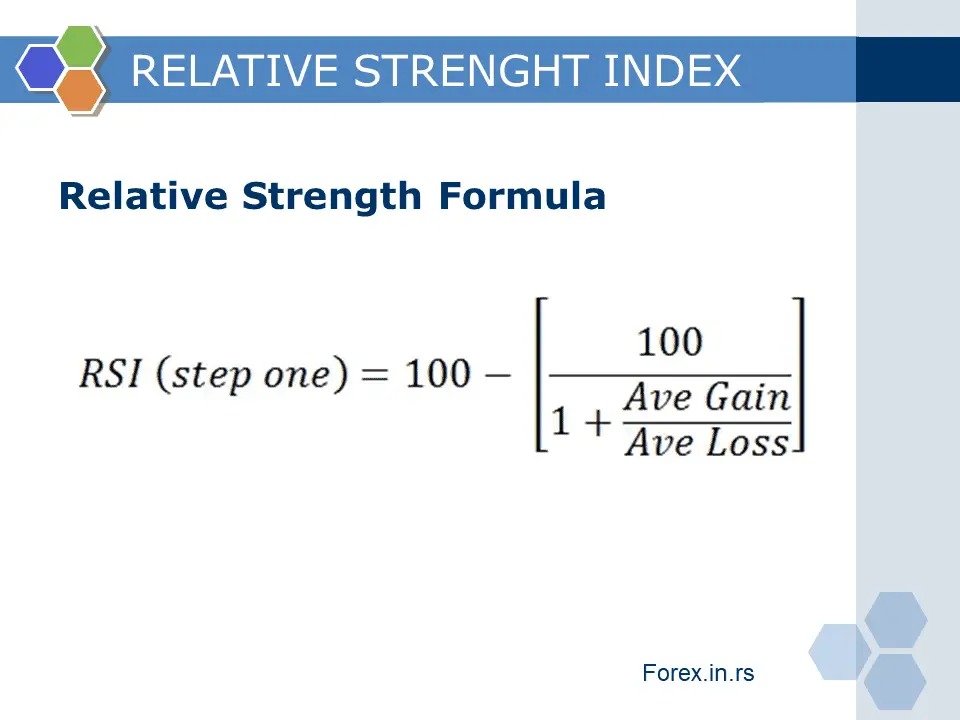
How is the relative strength index calculated?
To calculate RSI, you need to define the past period and average loss and average gain. In the last step, you need to calculate relative strength from average profit and average loss and get a value between 0 and 100.
The calculations for this indicator can put your mind into a whirlwind because of the complexity of the steps involved. Additionally, as technology evolves, technical traders bring their ideas to the table. Hence, the process of RSI calculation will vary depending upon the person you are consulting with. But fret not! There is much software that will run this calculation automatically for you.
However, it would help if you still pondered about the formula given by J. Welles Wilder Jr. in his seminal creation, “New Concept In Technical Trading Concepts.” This will give you an idea about the formation of RSI. It will also aid in implementing this strategy for trading signals.
The calculation involves the speed and direction of the asset price trend as two main components. Here is the four-step process that you need to follow here:
- Find the lookback period.
- Calculate the average loss over the lookback period and average gain.
- Use step 2 to calculate relative strength from average gain and average loss.
- You have to smoothen out the finding in step 3 to determine the outcome of RSI.
Proceed to read about these steps and know how to implement them:
- Step 1: Find RSI past period
The first step is to find data based on historical asset prices and security prices. To be clear, these steps involve using historical data to find the suitable historical periods that will help assess future price trends of an asset. The process of manually selecting numbers from a historical period is called the Lookback period.
A standard lookback period regularly gathers data from fourteen trading sessions on RSI or fourteen weeks for an RSI weekly. If you are more interested in day trading, 14 days is ideal.
Hence, you need to find a suitable lookback period that is the perfect fit for the market you indulge in and the psychology of trading to understand things from an enhanced perspective.
If you choose a lower lookback period, your calculations will be more refined and adapted to the price trends changes. The 14-day Lookback periods are the default; they deliver good trading signals to help technical traders incorporate the figures into their strategy for winning the trading market. However, suppose you are dealing with a market that is highly fluctuating. In that case, it is recommended that you ensure the lookback period is reduced and the adjustment for trading in the short run.
- Step 2: Find average gain and average loss
After acquiring the lookback period, the next step is to find the average loss and average gain against the selected period. Let’s understand this step with an example of a 14-day lookback period.
- Average gain: You need to sum up the total daily expenses in percentage for the last fourteen days and divide the total by 14.
- Average loss: For average loss, sum up all the daily losses in percentage for the last 14 days, and divide the total by 14. The average loss value will be positive but can stoop down to negative when adding up every loss.
- Step 3: Calculate RSI
The next step for RSI is to find the relative strength for a selected period. This step is crucial as the final result of the indicator precedes it.
The average gain and average loss you gathered in the previous step will come in handy. The formula goes as follows:
RS= 100 – [100/(1+ (Average Gain/Average Loss))]
This formula will bring the relative strength value between 0 and 100. Again, remember to implement the positive value for average loss, which will provide a rough interpretation of the relative strength of the price momentum of an asset.
- Step 4: Advanced RSI formula
As you acquired only a rough idea of RS in the former step, it is not the ultimate result. This is because technical traders need precise information and not just a massive chunk of data because of the high volatility and the relatedness of the historical momentum and the current momentum.
Hence, to calculate the RSI, Wilder utilized another formula to find a more succinct result. This formula goes as follow:
RSI= 100-[100/1+((Previous Gain*13+Current Gain)/(Previous Loss*13+Current Loss))]
This will come up with a result between 0 &100, and it is the final reading of the process.
What is a good RSI signal?
The good BUY RSI signal represents strong movement from below 30 to 50 levels. An additional characteristic of an excellent bullish RSI trend is when the RSI signal line angle is around 45 degrees. The good SELL signal represents strong movement from above 70 to 50 levels, where the RSI signal line angle is about 135 degrees.
If you are a trader to aspires to benefit significantly from your investment, it is crucial to understand what each value in this RSI scale means:
- Reading exceeding the 70 mark represents a situation where the asset is overbought. This is not an astute illustrator of reversal, but it tells the traders that inflation is taking over the momentum, but it will not sustain for long. Hence, many technical traders prefer to sell or short sell their assets during this period.
- If the reading on the scale goes below 30, the asset is oversold. Of course, this doesn’t indicate that the prices will rise soon, but it tells the trader that the asset holds the potential to be of more value than the market depicts. Hence, this reading tells traders to buy the stock readily before they become expensive.
- If your scale between 70 and 30 tells that there isn’t any trend persisting in the market and the trade being made is fair compared to the last 14 days.
Can RSI be trusted?
No, RSI can not be trusted as exact as you can not trust any other trading indicator. Therefore, you can not use RSI as only a trading trigger. However, if you have other triggers such as critical price level, trend lines, fundamental data, etc., you can use them with RSI to perform better.
If used alone, any financial tool becomes somewhat doubtful with the readings and is not part of a comprehensive trading strategy. RSI is not immune to this defect. Here are some reasons to justify this statement-
- Firstly new traders in the market are naive, and just by reading the overbought situation on the scale, they pan out that the reversal is inevitable. This can be the case for assets that are not on a spurt and have matured but new and robust assets in the decline phase. Additionally, when the trader uses these signals solely to make all financial decisions, it can lead to massive loss because of fake or misleading alerts.
- Moreover, several studies indicate that the 70+ oversold range and 30 or lower overbought might not be accurate for the assets that hold a strong position in the market. For example, many experts point out that several assets are overbought extensively during uptrends, and at such time the RSI scale is over 50. Conversely, such instruments are also oversold during the downtrend where the RSI scale is lower than 50.
Hence, to make RSI a reliable source, you need other tools to support its findings. Such tools can be charts, patterns, or other indicators. This, combined with different tools, will help you significantly eliminate the false signal generated by RSI.
What can you combine RSI with?
You can combine RSI with MACD, various moving averages, stochastic indicators, etc. The best approach is to determine basic price levels using past high and low prices or Fib. Levels or Pivot points. Then, you can combine RSI value and critical price levels as triggers to enter into trade.
Since the RSI readings can be misleading while being used solely and can lead you to losses or get no gains from profits, you must combine it with other reliable tools.
You can combine your RSI readings with divergence (bearish or bullish) to get a more actual result from the RSI reading. It will also help you accurately define if the asset is on the brink of significant modification in its trend prices.
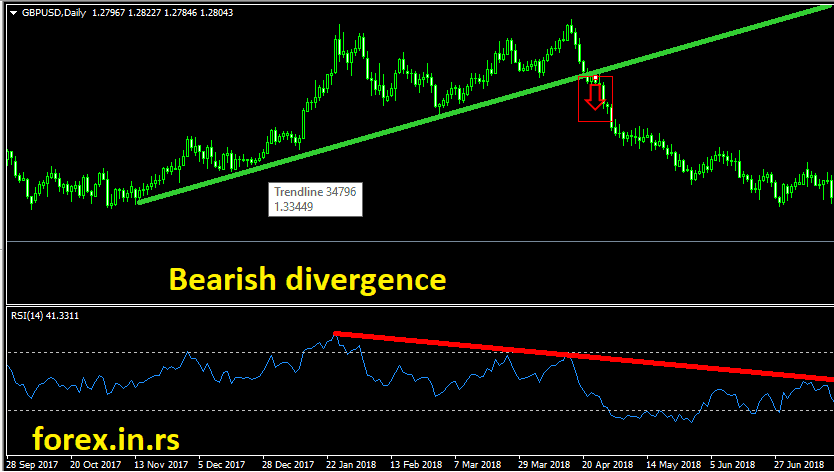
RSI divergence
RSI Divergence is the price movement process when an asset’s price (currency pair) moves in the opposite direction of an RSI indicator. Divergence warns that the current price trend may lead to a price-changing direction.
Please download the free divergence indicator for MT4.
Bearish divergence is prominent during uptrends for asset prices. During uptrends, the price of the assets keeps increasing and staying on the same trail. However, the RSI scale reading shows numbers lower than the previous reading, leading to bearish divergence. In contrast to the bullish divergence, a bearish divergence indicates a downward reversal of the asset’s price.
Bullish divergence dominates a downtrend in asset prices. During this reading, the prices are going down and down. However, the reading on the RSI scale indicates an uptrend, and the security is assumed to have bullish divergence. Thus, bullish divergence means extinguishing bearish divergence and a reversal in asset prices.
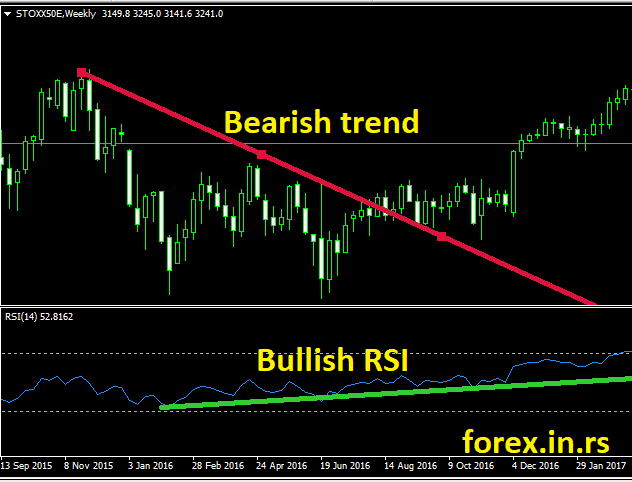
Therefore, the RSI readings of an asset being oversold or overbought, when combined with the divergence in the asset’s price trend, help get an accurate reading and act as an alibi for the signals. Hence, a combination of different strategies helps produce a more precise reading and has more substance.
You can also combine your RSI readings with other strategic tools and complementary strategies to do an accurate reading. For example, several tools are indicators like the RSI, while others differ because they provide visible results for a price trend.
You can combine RSI with:
- MACD or Moving average convergence divergence.
- Candlestick patterns.
- ADX or Average directional index.
- Support and resistance levels.
Let’s take a more in-depth look into how these tools can improve the RSI readings and support each phase.
How to use MACD and RSI?
MACD and RSI can be used in combination. Both indicators provide similar momentum strength price levels,s but if you use them in combination,n you can decrease the number of alerts and remove some false signals.
MACD is also a famous indicator, just like the RSI. However, it also works with momentum and guides the traders onto the path of profit. Its working is based on exponential moving averages that determine the hold of the price trend of an asset along with the momentum.
MACD is almost similar to RSI as it also determines if an asset is in an uptrend or downtrend and if there is a chance for reversal. However, though being the same in conclusion, the steps and calculations of MACD differ drastically from that of the relative strength index.
Hence, since the end goal of both RSI and MACD is the same but involves a different process, it is better to use them together to validate the conciseness of the signals and get more solid results. Moreover, if both the indicators are on the same page, they can help traders make a more robust stance in the market and aid their sell, hole or buy positions.
Does RSI have support and resistance?
RSI has support and resistance, and they are 0 and 100. However, RSI oscillates between real price support and resistance on the chart. If we have an uptrend, RSI will be above 40 and, the majority of the time, above 50. If we have a downtrend, RSI will be below 60 and, the majority of the time, below 50.
These are the most commonly used concepts by technical traders. The base plan of this indicator is to determine the stage at which the asset’s prices can face a reversal.
- Support is the concept that determines if there is an intense pressure to buy any financial security or instrument. Hence, if the price goes down for any asset, the investors deluge to buy it. Then, due to the creation of high demand, the price will be triggered and pushed into a bullish reversal, hiking the prices of that asset again.
- On the other hand, the resistance concept indicates strong sell pressure for an asset or security. Hence, as the prices surge, the holders will start selling their shares to rake in profits. Due to low prices, more and more short sellers enter the market and lead to the loss in momentum of the uptrend, triggering a bearish reversal for the same.
In conclusion, support and resistance are the points on any asset’s price chart where the probability of a reversal is possible. The foundation of this concept is created through buying and selling pressure of the securities. Therefore, support and resistance can help you achieve more accurate results with RSI readings. Here are some basic rules on utilizing this tool to your advantage.
- The price is somewhere around a support level when the RSI indicator has landed on an oversold situation. Hence the chances of a bullish reversal are at their peak. Therefore, you need to be prudent in indulging in a bullish trade.
- A bearish reversal is right around the corner when your RSI readings hover around the resistance point, with an overbought reading on the RSI indicator. Hence, you should bet on bearish trade to bring in considerable profits.
Average directional index (ADX) and RSI
ADX is another such indicator that is used with the RSI indicator. It measures the strength of the trend in an asset’s price. Therefore, it is also considered a verification point for finding the RSI indicator.
Read below to find out how ADX works with RSI:
- Since both RSI and ADX give signals about the reversals in the market, it is safer to analyze both results together to find better trade opportunities.
- When the two signals from RSI and ADX are not in sync, the reading for RSI is also deemed insignificant or less reliable, and you should not make a trading choice based on the RSI results.
Hence technical traders can strengthen their stance to buy or hold security if there are more similarities between the results of ADX and RSI.
Candlestick patterns and RSI
RSI and candlesticks can be used together as triggers to enter into trade. Candlestick is a commonly used and reliable trading chart used by most traders. The candlestick’s body on the chart determines the various stages in the price behavior of an asset and targeted information about high and low price and open and close positions. Candlesticks can also help find the reason behind a trader’s decisions, further providing information for the future stance of an asset.
Candlesticks are of two types based on the market psyche:
- Continuation candlesticks patterns.
- And reversal candlestick patterns.
When traders utilize these patterns along with the RSI indicator, they improve the accuracy of trading decisions. Given below are some essentials that help in using the candlestick patterns in combination with the RSI indicator:
- Continuations candlestick patterns: As the name suggests, a continuation candlestick pattern says that a price trend in the market is likely to continue. When the RSI shows an oversold or overbought trend in the market, and you see a continuation candlestick pattern on the chart, it is time to be intelligent with your decisions. Since the results from both the tools are heterogenous, you should refrain from trading at that time.
- Reversal candlestick pattern: Such patterns indicate that odds are in favor of a reversal in the trend of asset’s price. Hence, if your RSI reading depicts an overbought or oversold trend and you see a reversal candlestick pattern, you can rest assured that the former reading is correct. Hence, the candlestick pattern acts as an auxiliary to the RSI indicator, strengthening the reliability of the results.
In conclusion, the candlestick patterns determine whether you should be cautious or confident in the RSI indicator’s reading and act as a green or red signal for making trade decisions.
How to use the RSI strategy?
Here are the names of some trading strategies where the RSI plays a key role.
- RSI Reversal trading strategy.
- RSI Momentum trading strategy.
- RSI Breakout trading strategy.
Once you have learned how to enhance the accuracy of the RSI indicator, its calculations, structure, and foundation, you have to harness this knowledge for effective trading. You must use the signals and indicators mentioned above to make prudent trading decisions. It is not a game of hit and trail where you have many chances; once you lose the funds, they will hardly come back. Therefore, before making any decisions based on the results of trading tools, you need to have conclusive knowledge of each instrument and use it as a rung of the ladder to reach the top.
Now let’s talk about how these strategies help RSI identify set stop-loss levels, take-profit levels, and trade entries.
RSI Breakout trading strategy
Breakout trading strategy is a prominent strategy adopted by technical traders. The gist of this analysis is to trade in the market when the prices at a point breakout beyond support or resistance levels.
This breakout is accompanied by a dynamic movement in the breakout direction. This explosion in price benefits the traders and helps them earn profits by assisting in the trading decisions.
Fundamentally, you aim to bring in profits on sentiments of fear (bearish breakout) and ecstatic feeling (bullish breakout) and ride the volatile market to accumulate profits via the market psychology. But, unfortunately, these explosions in price are not stable. Hence, there will be a time when new resistance and support levels will be established, and this wave will lose its speed. In conclusion, you will experience excellent trading time with this strategy in the short run.
The relative strength index plays a significant role in finding the exits and entries when tracking the breakout strategy. Further, we will find out how one can determine trade entries, exits, take-profit, and stop-loss levels via this strategy and RSI.
Finding trade entry
When the asset is prone to a breakout, the RSI will show a situation that indicates oversold or overbought assets. Thus, in contrast to the previous assumptions, the indication of the RSI condition will show breakout patterns rather than a reversal.
Here is how you can determine the entry for breakout trade with the use of RSI:
- When the resistance level and asset price are in contact, and there have been multiple instances where the price was nearly 100 on the RSI scale, the bullish breakout might happen sooner rather than later. This indicates that it should take a long position in the market.
- On the other hand, when the price is near the support level, there have been multiple chances where the reading on the RSI scale was near 0. This is an indication of a bearish breakout. Therefore, the trader should take a selling or short selling position in the situation.
In conclusion, the crucial factor that is always included in this study is the support and resistance level where the breakout is most likely to happen. To practice this strategy, you can use traditional support and resistance levels like extension levels, pivot points, Fibonacci retracement, extension levels, etc., or utilize chart patterns like the wedges, flag pattern, head, and shoulders pattern, etc.
Finding stop-loss target
The step-loss target can be placed easily when there is a trade breakout because if it retraces back to previous support and resistance levels, then breakout isn’t taking place. Hence the guidelines for setting the stop-loss target for your trade is as follows:
- When you are in the market for long trade, the stop loss point will be somewhere behind the resistance level, near the break from where you entered the current trade.
- On the other hand, when the market is facing short-sell trade, the stop loss will take a position above the support level from the breakthrough you entered into the trade.
Moreover, once the price is nearing your trade position, you can put a trailing stop loss. This will allow you to drown in profits as you dive deep into the volatile price wave after the breakout while not enduring the risk of losing funds.
Establishing take profit target
The breakout intends for you to ride the explosive price wave and gain more than you expect. Therefore, it is futile to say that the take-profit level is integrated into this strategy. However, you should keep in mind not to set up too modest targets, as most experienced traders expect at least a 10% return from this strategy.
- In long trade, when the bullish momentum starts fading away, you will witness divergence on the price chart, and as such, you should consider closing the trade for gains.
- When the market is in a short sell position, the bearish momentum starts falling, you will see divergence on the chart, and it is a sign that a breakout pattern is slowing down. It is thus a sign for you to get profits by closing off the short position.
Hence, when there are breakouts in the trade, along with the readings of the RSI tool, other tools like Fibonacci Retracement and Extension levels can help you determine the take profit targets.
RSI Reversal trading strategy
This strategy works like magic for mature assets and the current price modifications, which are not backed by the fundamentals that inculcate the thought in the mind of investors that a pause in the trend is bound to be.
From the viewpoint of a technical trader, it is evident that RSI plays a pivotal role in determining price trends in the market. It is so because this is a simple tool that indicates whether an asset is overbought or oversold. However, it’s not such a complicated scale and helps determine the possibility of a reversal.
We also discussed how RSI is not reliable enough when being used independently. Hence it needs to be supported by complementary trade tools like chart patterns, candlestick patterns, support, and resistance to being more content with the results of the trading strategies. For instance, if the chart shows that a change in the bullish market is likely to happen, and RSI also shows an overbought position, the changes for big success on a short-sell trade are highly expected.
Furthermore, bullish and bearish divergence can gain more astute knowledge when there is a chance for trading reversal via RSe. They curb the high prices and highs. The lows show that the overbought or oversold position will likely bring a reversal. Hence, this combination with RSI is unbeatable.
Now it’s time to discuss how trade can exit and enter works with the reversal trading technique through the readings of RSI.
Establishing trade entry
It is now conspicuous that using the divergence technique is the most successful when determining trade reversals. So let’s have a look at how this strategy can be used to enter a trade position.
- When the market prices rise, the RSI will indicate an overbought situation, but the chart depicts that the prices are growing more rapidly than the previous high. Hence you should look for signs for selling short.
- On the other hand, when the market is seeing prices lower, the RSI will show the likelihood of a bullish reversal, then you should monitor the market and enter the trade as soon as you confirm a positive outcome.
To find the confirmation signals for a trade entry, you can use various tools previously evaluated. For example, you can use candlestick patterns or incorporate chart patterns to define the accuracy of the price trend.
Establishing stop-loss target
A stop-loss target in this strategy is placed where the signs of a reversal dominating your trade turned out to be a fluke. Hence, you will do the opposite of what we did to prove an entry point to establish the position.
- If the market is anticipating bearish trade, the stop point will be set up at some points beyond the previous high status. If the price still moves beyond this point, the reversal forecast gets turned around, and you need to exit the trade promptly to exit the trade their hand promptly; if the market is anticipating a bullish price trend, you need to place your stop position at some points below the recent low. If the price goes below this point, your reversal forethought is not verified, and you need to get out of the trade.
Here are some ways you can also utilize RSI for scooping out the loops in your reversal hypothesis.
- When making a bearish trade, after the divergence at the starting point, if the RSI scale depicts an overbought inference and the reading bounces back to an even higher position, it represents the end of divergence on the chart. This invalidates your reversal postulation.
- On the other hand, if you are making bullish trade, and the RSI reading shows an oversold situation that is less than before, your reversal postulation is again proved wrong. Hence, closing the position is a prudent choice here.
Establishing take profit target
The technical traders who enjoy the reversal trade also aim to acquire justified returns from their investment. Though the actual value depends upon the extent of trade and risk taken, a profit of 5%-10% is an acceptable rate. These profit targets are always set lower than the breakout points because of the looming threat of reversal.
To make your stance stronger in the market, here are some tactics you can use to determine a profit target.
- Once you have pushed your trade into a profitable position, you should find signs of divergence contrary to the trade entry. For instance, if you were trading based on bullish divergence, find bearish divergence, and once it is evident for it to occur, close your trade and gain profits.
- You can also use tools like Fibonacci Retracemension levels to find your exit prospects find the confluence of RSI, and these strategies will enable better exit strategies.
- Whenever you use these strategies for trade, the chart patterns will convey some high-level rules about establishing your trade profit point. Hence, using them can help in the curation of exit plans.
RSI Momentum trading strategy
The momentum trading strategy is the most uncomplicated trade strategy around. The base of this strategy is “buy low, and sell high,” which is widely practiced in the trade market. People who lean towards short selling will adopt the contrary strategy “sell high, and buy low.”The RSI is also a momentum oscillator, which blends perfectly with this strategy. RSI depicts the oversold and overbought price trends, showing that the price modification is not actual and will alter a bit. However, the market can often contradict this reading.
Nevertheless, RSI still has the trust of the traders when it is combined with some subtle changes and tools; it can deliver accurate results. This is the most relevant for matured securities.
Let’s find how you can find suitable entry and exit points with RSI and Momentum Trading Strategy.
Establishing trade entry
RSI is a marvelous tool for finding a trade entry for momentum strategy in several situations. While when the prices are on the rise, it will always indicate an overbought condition, and unwavering low price trends will mean oversold situations.
This strategy is only ideal for the range-bound market. To find the range to implement this tool, you can use envelope trading indicators and pricing channels like Donchian or Bollinger channels.
Once you have chosen your range, you can implement this strategy without any hurdles along the way. You can enter in the trades of momentum using the following principles:
- You should take a long position when the asset’s price ranges near the support point and RSI is insinuating an oversold situation.
- On the contrary, you should take a short position when the RSI shows an overbought situation and the asset’s price is fluttering around the resistance point.
Establishing stop-loss target
The momentum trading strategy is ideal for short-term trades and the best for day trading. During such trades, finding a stop-loss strategy derails from all our previous methods as the mindset here is to stick with the flow.
You don’t need to alter the fundamental of the strategy but incorporate it with these guidelines:
- The first step is to set up a stop loss some points above the resistance line while trading in the bearish market. This acts as a sheath from the losses if there is a breakout from your chosen range.
- If you are doing trade in the bullish market, the stop loss should be set up below the support points to curb losses when a bearish breakout occurs.
If you are a trader interested in highly short trading or scalping and trade in high volumes, consider setting up your stop loss point somewhere around 5% or above or below the entry points to prevent losses when the price momentum dwindles.
The RSI will move to its normal range of 30-70 before the reversal occurs. This shows the price is prone to breaking out beyond the range. Hence, giving you additional signs to exit the trade.
Establishing take profit target
Since the price changes are bound by range in this strategy, it would be futile to expect the kind of profits traders gets from reversal or breakout trading. In a general sense, anticipating a 5% profit is reasonable. How much returns you get in reality depends upon the risk tolerance, volume, and the type of asset. Most of the scalpers take a basic standpoint of 2% as a strong exit point.
Here are the tactics you can use to determine trade profits to make good profits through this strategy: You should put your stop loss point somewhere around the support ring when making a bearish trade. Hence, the oversold RSI indication will solidify your position when the price comes up to your exit target.
- On the contrary, when you are making bullish trade, you should set the profit target below the resistance line and exit the trade when the RSI indicates overbought.
Pros and cons of RSI
Like any tool and instrument have their own strong and weak points, and in the same way, RSI also has its own set of pros and cons. It is without any doubt an excellent tool to determine the momentum of the asset’s price, but if used without auxiliaries as the cons of the indicator kick in.
This section will comprehensively explain the disadvantages and advantages of relative strength indicators. Then, when you know where it falls short, you can use the other strategies to compensate for it.
What is the benefit of RSI?
These are the strong points of this widely used tool: The results are relevant when the RSI indicator is combined with the results from other effective strategies and tools.
- RSI is an intuitive tool that traders can easily understand at all levels.
- If you are a day trader, RSI will be beneficial for your trading decisions.
- RSI acts as a confirmation for predicting reversals or breakouts for other strategies.
- These RSI signals are also relatively easier to combine with different strategies and trading situations.
Cons of RSI
The primary cons of RSI are as follows:
- It can often deviate from the signals of different instruments and strategies.
- RSI can determine the chances of a reversal but not give an idea about the exact points.
- If the trends in the market are going strong, the oversold and overbought indicators can be negatively affected. For instance, in an overbought situation, the prices might amp up way higher than expected, and you will fail to leverage those profitable periods.
- RSI is only focused on asset price momentum while a heap of other factors leads to a profitable trade.
- RSI is not as effective when used without other tools because the market can often be in contrast to the reading of RSI.
Conclusion
A relative strength index is a crucial tool for technical analysis. Although it was created in 1978, it has been modified drastically to fit the current trading scenarios over the years. This includes variations in signals, calculations, and smoothing formulas. This makes RSI a tool with the innate ability to guide a technical trader through the stream of hurdles in the market.
It uses RSI to create any exit or entry plan that needs you to comprehend every measure and result that the tool lands on. For starters, it is a tool that is essentially used for following the price trend of an asset or the momentum. For example, if the scale point at 70 or above indicates an overbought situation, a range of 30 or below shows an oversold condition.
RSI is ancient and reliable but not as reliable when used individually to create entry and exit strategies. However, it works great to provide you with a confirmation and verify your forecast about an asset analysis when you are trading. Traders are only dependent on RSI to derive the primary strategy for entering or exiting a trade. Therefore, it is more applicable to day traders. This helps you make precise trading decisions when used with indicators like resistance and support, MACD, candlestick patterns, ADS with the RSI strategy.
The RSI bears succinct results when you use several other technical indicators to land on a conclusion. This helps traders establish stop-loss, take-profits, and entry and exit points. The three commonly used trading strategies are breakout trading strategy, momentum trading strategy, and the reversal trading strategy. These are useful in both bullish and bearish conditions.
The conclusion is you can use as many technical indicators as you want, but there is never a surety about what will happen next in the trade market. Nevertheless, if you use RSI and other financial instruments with persistence, your gains will increase in the extended period.

He is an expert in financial niche, long-term trading, and weekly technical levels.
The primary field of Igor's research is the application of machine learning in algorithmic trading.
Education: Computer Engineering and Ph.D. in machine learning.
Igor regularly publishes trading-related videos on the Fxigor Youtube channel.
To contact Igor write on:
igor@forex.in.rs
