Table of Contents
The RSI divergence indicator comes in handy when price action and the RSI indicator are not showing the same direction and pace of momentum. RSI is a momentum oscillator that reads the changes in the price direction to define an asset’s overbought and oversold situations.
What is the RSI Divergence indicator?
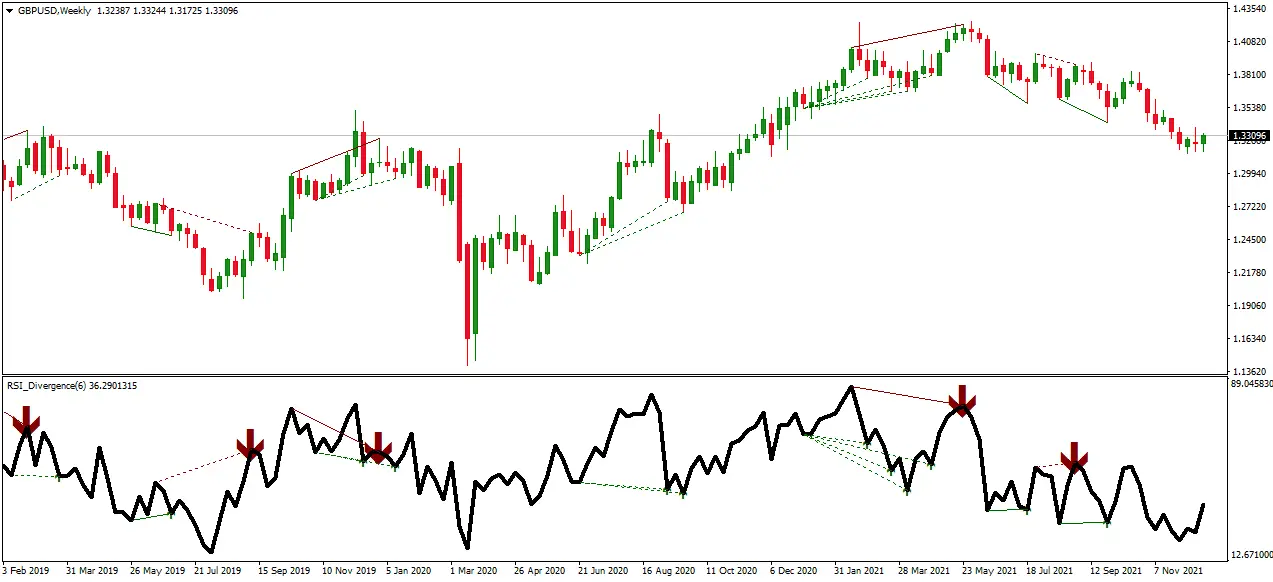
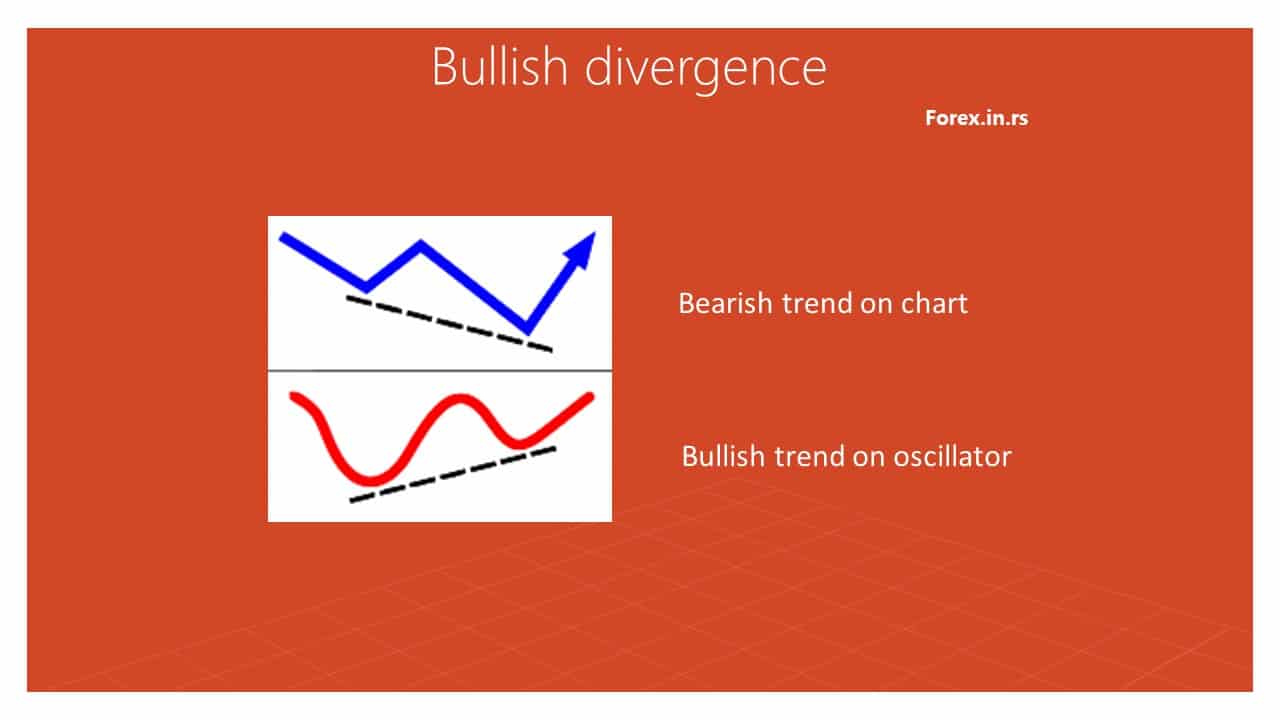
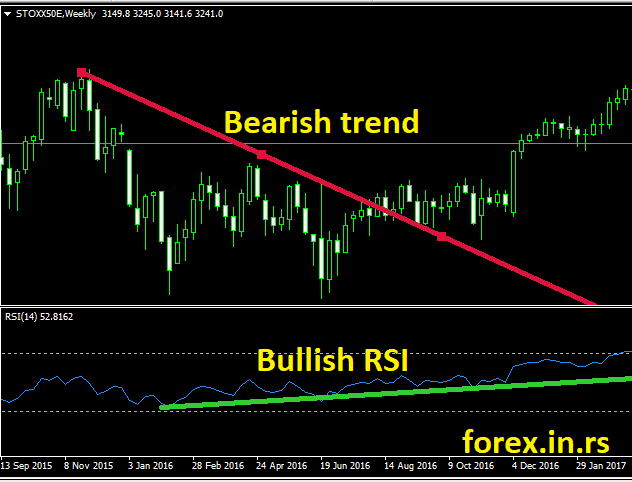
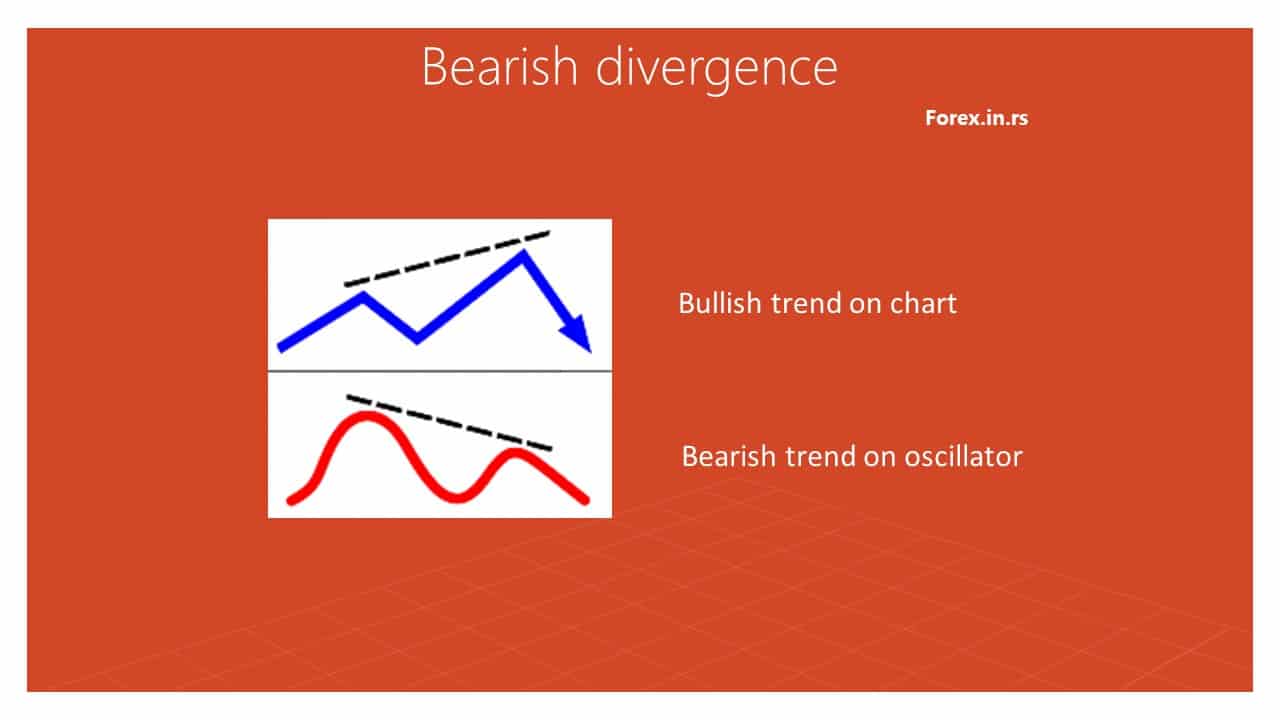
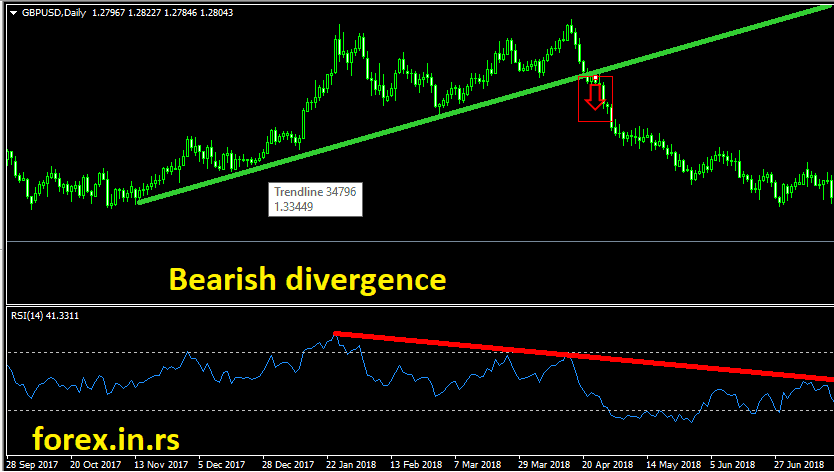
RSI divergence indicator detects bullish and bearish divergence on the chart. Bullish divergence is seen when the chart’s price makes lower lows and the RSI indicator higher highs. Bearish divergence is detected when the price makes higher highs and the price on the RSI indicator lowers lows.


Divergence indicator MT4 download:


DOWNLOAD RSI DIVERGENCE INDICATOR
The divergence indicator displays that the market will continue to pull back. The generic RSI indicator will show a low-high situation if there is a divergence on the RSI chart. This is when the price does higher highs. The divergence indicator will display higher lows when the price shows lower lows.

The RSI divergence happens when the index stops reaching the higher highs during an upward movement or breaks the lower lows in a downward direction.
If there is divergence present in the trend, it has lost momentum. This is a sign that the trader should be maintained to bet on direction reversal in the market activity of the price.
If bullish divergence is present in the market, the security is oversold, which comes after a higher low resulting from the lower low. On the other hand, the bearish divergence appears on the chart when RSI reflects an overbought situation after a lower high that ties up with the higher high.
Buy and sell signals.
To pin out the buy and sell movement on the indicator, you must first find the bearish and bullish divergence. Bullish divergence means buy intent, and bearish divergence means sell goal.
Buy signal
If a chart shows an uptrend, you will find it beneficial to enter the trade as the indicator depicts lower highs and an oversold situation. Hence, giving the green light for a bullish divergence.
If you want further confirmation, you can see the candle pattern, or based on the RSI’s oversold situation depiction; you can enter a trade. The stop-loss point should be established near the low end and exit where the RSI divergence moves towards a downtrend.
Sell signal
The price will pull back and continue downward when the divergence indicator displays overbought momentum at a higher low.
When RSI displays the overbought situation, you should enter the trade, place the stop-loss signal near the previous high, and exit if the RSI divergence starts moving up.
Final thoughts
The fundamental RSI indicator is more susceptible to false signals, and even overbought and oversold situations often don’t show up. If you combine the RSI divergence indicator with RSI, you can clarify where the trade is going.

He is an expert in financial niche, long-term trading, and weekly technical levels.
The primary field of Igor's research is the application of machine learning in algorithmic trading.
Education: Computer Engineering and Ph.D. in machine learning.
Igor regularly publishes trading-related videos on the Fxigor Youtube channel.
To contact Igor write on:
igor@forex.in.rs
