Table of Contents
The volatility of 75 indexes is usually abbreviated as VIX and indicates the volatility of one of the most closely monitored stock indices, the S&P 500. VIX indicates the market’s fear; when it exceeds 30, it is in fear mode. The level of fear is directly proportional to the VIX value. If the VIX is less than 30, it indicates complacency. The VIX is ideal for traders who wish to profit from volatile markets or hedge in the short term.
If you trade stocks, you can try the Trading Ideas website or TrendSpider, which uses the VIX 75 index to pick the best trading opportunities.


What is the volatility 75 index or VIX?
The volatility index or VIX or volatility 75 is a special CBOE (Chicago Board Options Exchange) index created to measure the volatility of the S&P500 index. VIX Index projects the probable range of movement in the U.S. equity markets, above and below their current level, in the immediate future, usually the next 30 days. This volatility index is often known as the “fear index.”


So, we can describe VIX using the following facts:
- The VIX is a real-time market index that measures the market’s expectation of volatility in the S&P 500 index over the next 30 days.
- It is also known as the “Fear Index” because it tends to rise when investors are worried about market volatility and uncertainty.
- The VIX is calculated based on the prices of options contracts on the S&P 500 index, which are used to hedge against potential market downturns or fluctuations.
- The VIX is a numerical value that ranges from 0 to 100, with higher values indicating higher levels of market volatility and uncertainty.
- Traders and investors often use the VIX to gauge market sentiment and make trading decisions based on market volatility expectations.
- It is important to note that the VIX does not predict future market movements or trends but instead measures the current level of expected volatility in the market.
- The VIX tends to have an inverse relationship with the S&P 500 index, meaning that when the S&P 500 is performing well, the VIX tends to be low and vice versa.
- The VIX can be traded through futures contracts, options contracts, and exchange-traded funds (ETFs) that track the index.
- Trading the VIX can be risky and complex, as it is a highly volatile and fast-moving index that can experience sudden and significant price movements.
- Traders and investors must understand the VIX and its characteristics before incorporating it into their trading strategies or investment portfolios.
Let us see the steps on how to calculate the VIX 75 index:
The VIX is often called the “fear index” or “fear gauge” because it represents one way of measuring the market’s expectation of stock market volatility over the next 30-day period. However, the specific “VIX 75” does not exist as a standard term in finance; the regular VIX index is often referred to in discussions about market volatility.
Here’s an overview of how the VIX index is calculated:

- Selection of Options: The VIX calculation uses a wide range of S&P 500 index options (calls and puts) expiring in the near and next-term months.
- Time to Expiration: It accounts for options with more than 23 days and less than 37 days to expiration.
- Mid-Quote Prices: The mid-point between bid and ask prices for each option is used.
- Forward Index Level Calculation: A forward index level derived from the prices of the selected options is used to estimate what the S&P 500 is expected to be at the expiration date.
- Calculation of Expected Variance: The expected variance is calculated using the differences in option prices across strike prices. This involves a complex formula that integrates across all the selected strike prices.
- Annualization: The expected 30-day variance is then annualized (multiplied by a factor to convert a 30-day measure to a 365-day measure).
- Square Root: Finally, the square root of the annualized variance is taken to arrive at the VIX value.
VIX does not measure the direction of stock market moves; instead, it measures the market’s expectation of future volatility, regardless of direction. It’s also a model-driven calculation based on theoretical assumptions and models about how option prices behave rather than direct statistical measures of stock market volatility.
What is the VIX index today?
[stock_market_widget type=”inline” template=”generic” assets=”^VIX” markup=”Current VIX stock price today is {price}.” api=”of”]
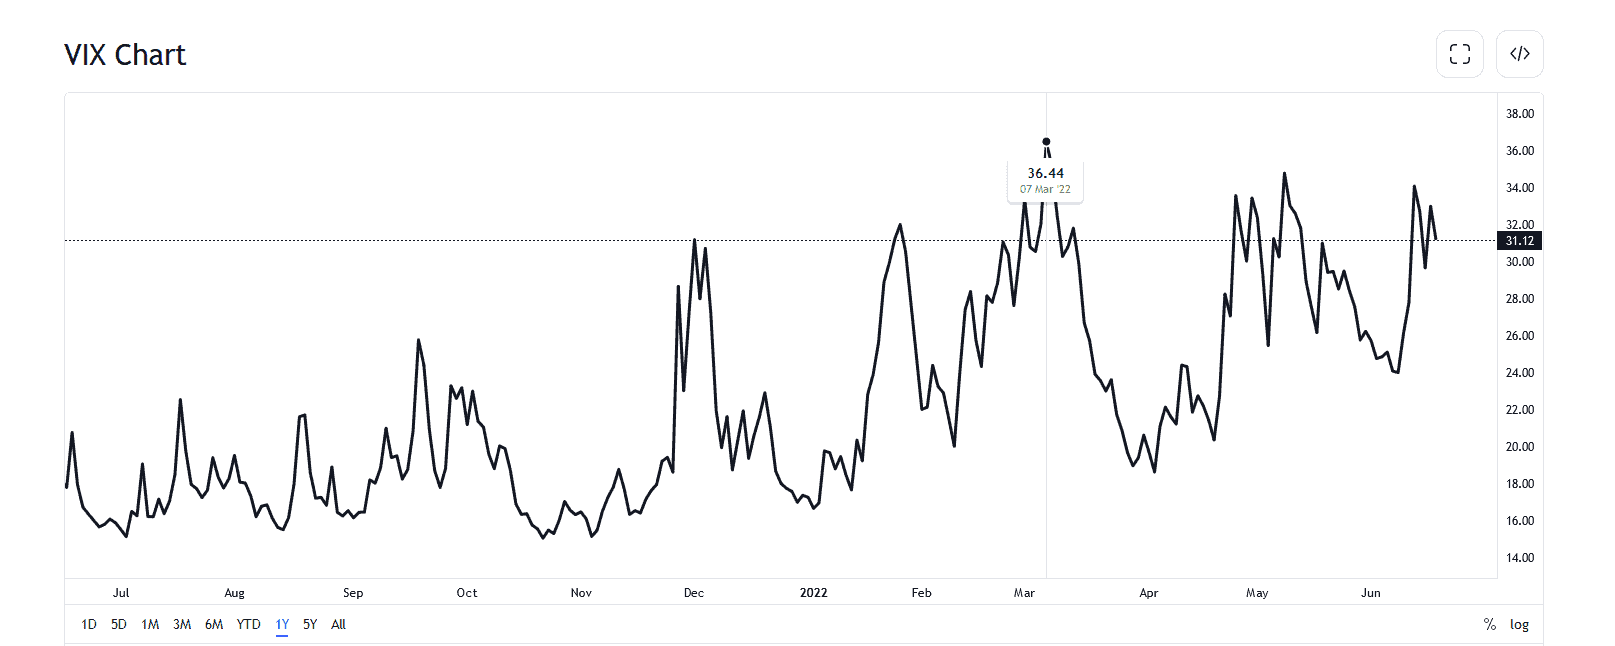
Below is a live VIX chart where you can see the VIX index today’s value:
[stock_market_widget type=”chart” template=”basic” color=”#5679FF” assets=”^VIX” range=”1mo” interval=”1d” axes=”true” cursor=”true” range_selector=”true” display_currency_symbol=”true” api=”of”]
The Vix index is calculated and measured by CBOE in real time. This can offer the investors’ sentiment and measure all related market risk factors. Experienced marketers and analysts estimate the market’s risk factors and measure the stress and fear before investing or taking any investment ideas.
VIX can measure and calculate the level of implied volatility. There is a wide range of options that you can get. This indicator can help investors reflect the best predictions of near-term market situations. In general, the Volatility Index starts to rise during financial stress. Therefore, it is the best market prediction of near-term volatility.
How do you get volatility 75 indexes on MT4?
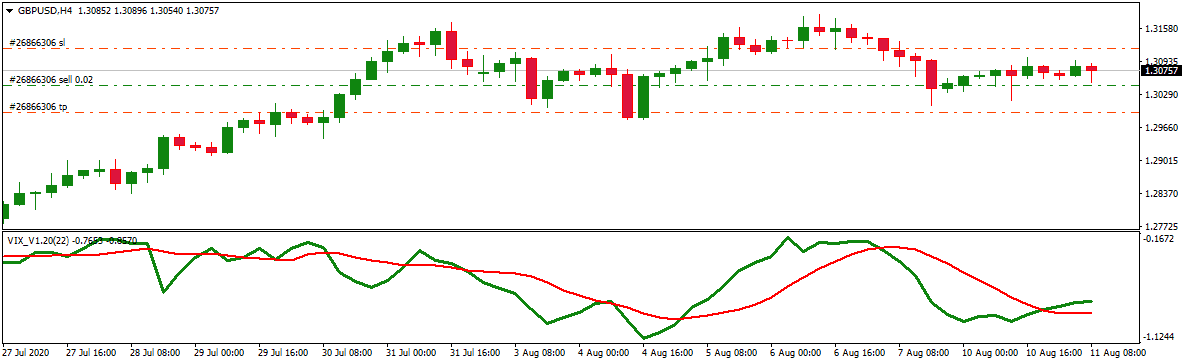
VIX indicator Download
How does VIX work?
The VIX usually has a negative correlation with the S&P 500. When the VIX rises, there are significant price fluctuations in the S&P 500 (SPX). Usually, when the VIX rises, SPX falls in price due to increasing investor fears; the opposite, when the VIX declines, SPX rises. This negative correlation shows how the VIX index works because investors can use the VIX to measure the fear level, risk, and stress in the trading market.
The high Volatility Index reflects investors’estors’ fear. It is repeated in the bear and bull cycle. You can notice that during market turmoil, the Volatility Index will spike high and widely reflect the panic and massive demand for OEX puts fur, thus reducing a stock portfolio. Conversely, you can notice less fear during a bullish time and do not need portfolio managers to buy puts.
How do you trade the volatility 75 indexes on MT4?
In MT4, traders can use the Volatility 75 Index to measure future volatility to set stop loss and target price levels better. This indicator can help traders to decide when to close the trade. However, this indicator can be very dangerous to use alone in trading decisions if you do not use other triggers, such as price levels, divergence, oscillators, etc. During the volatility periods, check your deviation for the quoted price because of the “off quotes” MT4 error.
Is High volatility good or bad?
Volatility is not the same as risk and is neither bad nor good. Volatility can be an opportunity for profit (good) when the market creates strong movement in one direction, usually during important news, either a robust breakout setup or a continual solid pattern.
However, some stocks or assets can plunge because of bad news, weak company news, or weak economic news, and then everybody sells, and volatility increases. Mixed market signals and substantial price spikes are examples of when volatility is not an opportunity and represents risk.
Please read our article on how volatility and risk are related to an investment to see when volatility is an opportunity and a risk.
V 75 traders should wait for the perfect time to trade volatility index 75 for consistent profit. However, many traders enter the trade market at the wrong time. Their timing is terrible. This leads to the loss of their account. So, the right time and trading skills are significant and essential to profit and reduce loss. It also needs a sorted frame of mind and patience. Professional traders win the profit most of the time by following this tactic. Successful traders do not enter the market all the time. They judge and do good research about the market before making their entry.
The good volatility index 75 trades are generally entered at the point of breakouts and reversal time. The candlestick patterns or methods will help you enter a profitable and booming market. Apart from this, the price of V75 is related to the USD Index.
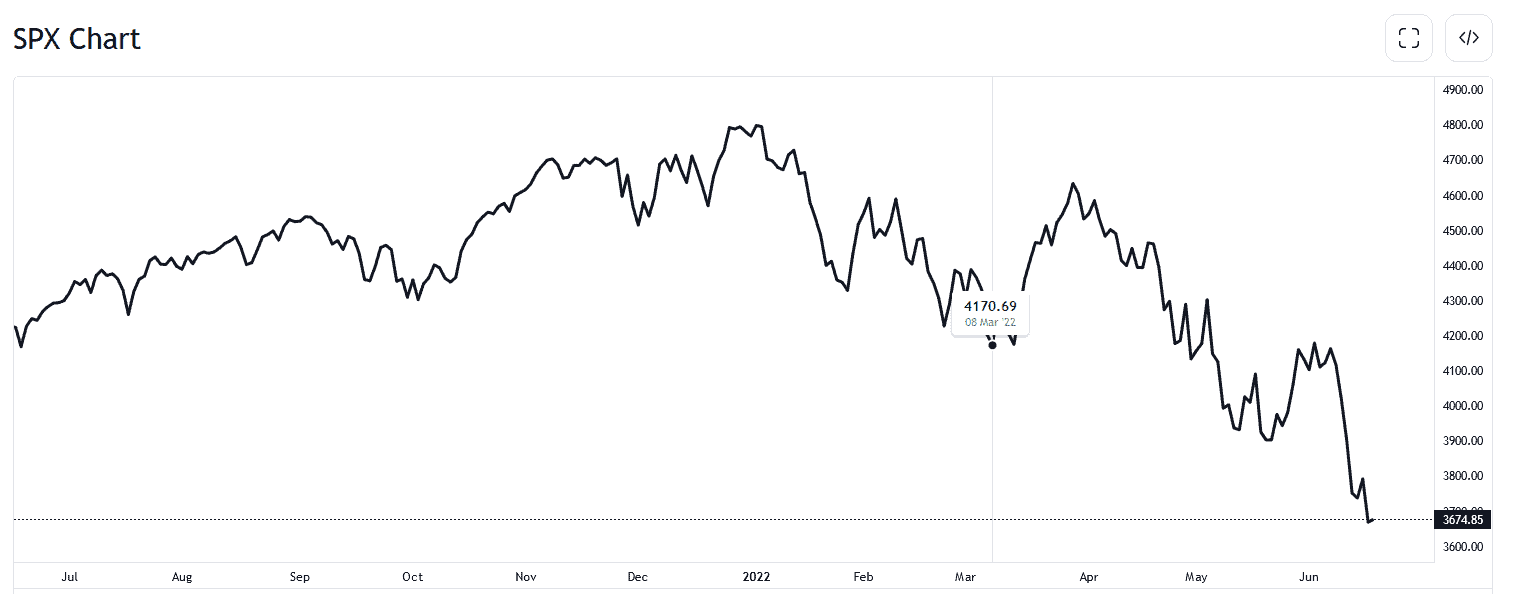
For example, the Volatility 75 index was high on March 8. 2022. The stock market declined that day, and many stocks went down.
As we can see below, on March 8, the S&P500 touched its bottom:
Best time to trade volatility indices
The best time to trade volatility indices is one hour after the London market opens and one hour after the U.S. market opens. The most considerable liquidity is in that period. However, trading one hour after opening helps traders avoid huge spikes and enough time to identify a daily trend. The best time to trade indices is when the U.S. trading session overlaps the London session (12.00 GMT – 16.00 GMT).
It can be advantageous to trade indices during the overlap of the U.S. trading session and the London session for several reasons:
- Increased liquidity: The overlap of the U.S. and London sessions significantly increases trading volume and liquidity, leading to tighter bid-ask spreads and lower transaction costs.
- Greater volatility: With more traders participating in the market, there is often greater volatility and price movement during the overlap period, which can provide profit opportunities.
- Important economic announcements: Many critical economic announcements, such as GDP and employment reports, are released during the overlap period, which can cause significant market movement and create trading opportunities.
- Trading opportunities across multiple time zones: The overlap of the U.S. and London sessions allows traders to trade across multiple time zones and take advantage of market movement in both regions.
- Access to global markets: The London session is a crucial trading session for many global markets, including Europe, the Middle East, and Africa. Trading during the overlap period provides traders access to these markets and the opportunity to diversify their portfolios.
Read more in our article What is the Best Time to Trade the Volatility 75 Index.
What is a traditional measure of volatility?
Standard deviation is one of the traditional and typical statistics to measure volatility. It is defined as the square root of the average variance of the accurate data. The statistic is simple to calculate, but the interpretation’s assumption is tricky and raises—. As a result, it raises concerns about its accurate results.
So, the standard deviation is an accurate method of calculating the risk factors of The market. However, the investment performance data is not well distributed. There are some reasons behind that:
- The investment’s performance is generally skewed, resulting in asymmetrical returns. So, due to this fluctuation, the investors need to experience high and low performance.
- The investment performance reveals many negative and positive periods of overall performance.
Apart from the standard deviation, there is a much simpler and easier way to measure volatility. Through the historical method, you can examine and calculate the risk factors. So, the care requires a graph of the investment’s historical performance. Then, they follow a chart known as a histogram. Finally, they calculate and measure the market’s volatility through this chart.
In this chart, the proportion of observations falls within various category ranges. Therefore, this chart will allow the investors to determine and calculate the percentage of the time.
What is the difference between historical and implied volatility?
Implied volatility represents future volatility where the market forecasts a likely movement in a security’s price, while historical volatility measures past trading ranges of assets. Historical volatility is a statistical measure of the dispersion of returns for assets during a time.
While historical volatility is calculated by taking the standard deviation of the natural log of the ratio of consecutive closing prices at hand, implied volatility uses the Black-Scholes formula.
Implied volatility is known as projected volatility. It is one of the necessary metrics for traders. It allows them to consider how the market’s volatility is going further in the future. This is one of the best ways to calculate the probability of the market. Through this method, you can forecast how the market will move shortly. As implied, traders and marketers cannot use their past performances.
On the other hand, Historical Volatility gauges the market fluctuation and underlying security facts. So, as you can see, it is not a forward-looking metro you.
How to trade the VIX 75?
VIX 75 or volatility index, you do not trade as an asset. Instead, you use VIX 75 to measure volatility and use it as one additional trigger in your overall strategy.
In this way, you can use the volatility as a tradable asset. CBOE launched it in the year 2004. The Volatility of Index-linked instruments helps to get proper exposure. But you cannot purchase VIX directly. Instead, you must take a position in the Volatility Index through many exchange products. Then, the traders can make their bets in accurate proportions through the high beta stocks to correct the price of their trade options.
Apart from this, sentiment plays an important and necessary role in market decisions. So, it is a good idea to glance at the Volatility Index. But before making any decision, you must know that success in the market will not predict the future. So, you need help from an experienced and practical person in this regard. The volatile period is very much beneficial to planning your financial success. So, it would help if you turned the market’s volatility in your favor.
Which broker has a volatility index VIX 75?
Today, all major forex brokers offer VIX. List of brokers that trade volatility index
HFM broker that has volatility 75 indexes. Hotforex is regulated and is one of the biggest world forex brokers. For Hotforex clients – VIX can be used as an indicator.
HFM is one of the top volatility 75 index brokers in South Africa. Hotforex has separated regulated branches in South Africa.
Avatrade is a global online broker offering CFDs, Forex, Social trading, and spread betting. It was founded in 2006 and is located in the British Virgin Islands. A demo account is available, and a minimum deposit of $250 is required for trading. Traders can use the Android, iOS app, and MT4 forex platforms. It is also suitable for bers and has more than 80 currency pairs and 250+ instruments for trading. It allows hedging scalping. Micro, Islamic, and standard accounts are some of the account options available. English, Greek, French, German, and Italian are some available languages.
Saxo Bank offers VIX 75
Saxo Bank is ideal for traders who can afford to deposit USD 10,000 initially at competitive pricing. For U.K. traders, the minimum deposit is GBP500. In addition, it offers multiple trading platforms, high-quality research, good customer service, and more than 40000 instruments for trading.
Saxo Bank operates a bank and is considered low-risk. It is not traded publicly and is authorized by six tier-one regulators who are highly trusted. It offers classic, platinum, and VIP accounts with a minimum deposit of USD 10,000, USD 200,000, and USD 1,000,000. The SaxotraderGO is a b-based, feature-rich trading platform with about 20 drawing tools and 55 indicators, including the auto chartist trade signals. The SaxoTraderPRO is an enhanced version with enhanced features. In addition, it’s excellent in-house research.
I.G. Group
I.G. has a wide range of 17,000+ and 17000+ tradeable instruments, excellent tools, and rates. It operates a regulated bank, is publicly traded, and is low risk. Six high trust regulators authorize it. For high-volume traders considered professionals, I.G. charges lower commissions with Forex Direct, which uses interbank liquidity. In addition to its web-based platform, it also offers other platforms like MT4. A mobile app is also available. Pro-real-time charts and alerts on specific indicators can also be provided. Research from Autochartist is also public.
XTB
XTB is another global online broker offering Cryptocurrency trading, CFDs, and forex. It was founded in 200 and had a head office in Poland. The reputed broker allows it to trade over 50 currency pairs and over 1500 instruments. The trading platform forex trading platform is Xstation5 trading. Mobile apps are also available. Some available languages are English, Czech, Chinese, French, Spanish, Italian, Portuguese, Polish, Romanian, Turkish, and Slovenian.
Conclusion
The VIX 75 index, serving as a key barometer of market sentiment, is crucial in providing insights into investor expectations of volatility in the financial markets. It reflects the collective attitude of investors towards risk, often spiking during periods of uncertainty and declining in more stable times. As such, the VIX 75 is not just a tool for gauging fear and uncertainty but also an essential instrument for traders and investors looking to understand and navigate the complexities of the market. VIX significance in portfolio management and risk assessment underscores its vital role in the broader financial landscape.

He is an expert in financial niche, long-term trading, and weekly technical levels.
The primary field of Igor's research is the application of machine learning in algorithmic trading.
Education: Computer Engineering and Ph.D. in machine learning.
Igor regularly publishes trading-related videos on the Fxigor Youtube channel.
To contact Igor write on:
igor@forex.in.rs
